At a Glance
- •ERR_EMPTY_RESPONSE means the server accepted your connection and received your request, then closed the connection without sending a single byte back. DNS worked and something was listening, so the fault is almost always on the server.
- •The three server causes in order: a worker process that crashed or was killed mid request (out of memory kills, PHP-FPM or Apache segfaults, Gunicorn timeouts, Node.js crashes), a server configured to hang up (Nginx return 444 in a default server block), and an app in Docker listening on 127.0.0.1 instead of 0.0.0.0.
- •Reproduce it with curl -v. "curl: (52) Empty reply from server" is the same failure. Intermittent failures point to dying workers, instant failures on every request point to a deliberate close, and failures only from outside a container point to the wrong interface.
- •As a visitor, test on mobile data first. If the site fails there too, nothing on your computer will fix it. If it works, turn off your VPN and antivirus web protection and try Incognito. Flushing DNS does not help.
- •Behind Cloudflare the same failure shows as error 520, and behind Nginx as a 502. An uptime monitor fails the check on an empty reply. Notifier is free for 10 monitors with SSL and DNS monitoring included, and paid plans start at $4/month for 1-minute checks.
Chrome shows a page reading This page isn't working, followed by example.com didn't send any data, and the code ERR_EMPTY_RESPONSE. It is one of the most literal error messages a browser produces. The server accepted your connection, and then closed it without sending a single byte back.
That detail matters more than it looks. A server that is switched off refuses the connection. A server that is unreachable times out. A server that answers with an error at least sends a status code. An empty response means something was listening and chose, or was forced, to hang up before saying anything. That narrows the list of suspects to a handful, and most of them are on the server.
This guide covers what the error actually means, a short and honest set of visitor fixes, a diagnosis you can run with curl in under a minute, and the three server causes that account for nearly every case. If you do not run the site, jump to the visitor section.
What ERR_EMPTY_RESPONSE Actually Means
Loading a page takes three steps. Your browser opens a TCP connection to the server, sends an HTTP request over it, and waits for the response, which starts with a status line such as HTTP/1.1 200 OK. ERR_EMPTY_RESPONSE means the first two steps worked and the third never started. The connection was closed cleanly with zero bytes of response.
Other tools describe the same event in their own words:
- Chrome and Edge: ERR_EMPTY_RESPONSE, "didn't send any data"
- Safari: "Safari can't open the page because the server unexpectedly dropped the connection"
- Firefox: usually "The connection was reset", or occasionally a blank page
- curl:
curl: (52) Empty reply from server
Three things follow from this, and each one saves you time:
- DNS is fine. Your browser found an IP address and connected to it. Flushing your DNS cache or changing DNS servers will not help, which rules out a large share of the generic advice written about this error.
- Something is listening on the port. If nothing were, you would see ERR_CONNECTION_REFUSED instead. A firewall silently dropping traffic would give you ERR_CONNECTION_TIMED_OUT.
- The thing listening did not produce a response. Either the process handling your request died, it was configured to close the connection on purpose, or the listener was a relay with nothing behind it. Those are the three causes below.
How It Differs From Similar Errors
Several failures look alike in a browser and point to completely different places. The quickest way to tell them apart is to ask how far the request got.
| What You See | How Far the Request Got | Where to Look |
|---|---|---|
| ERR_NAME_NOT_RESOLVED | No IP address found | DNS records and domain registration |
| ERR_CONNECTION_TIMED_OUT | Packets sent, nothing came back | Firewalls, server offline, network path |
| ERR_CONNECTION_REFUSED | Server reached, nothing listening on the port | Web server stopped or wrong port |
| ERR_CONNECTION_RESET | Connection torn down abruptly with a reset packet | Middleboxes, firewalls, crashing processes |
| ERR_EMPTY_RESPONSE | Request sent, connection closed cleanly with no reply | Worker crashes, deliberate closes, port binding |
| 502 Bad Gateway | Proxy answered, but its backend failed | The application behind Nginx or a load balancer |
| Blank white page | Full response received, usually 200 or 500, with an empty body | Application errors with display turned off |
The 502 connection:
ERR_EMPTY_RESPONSE and 502 Bad Gateway are often the same failure seen from two places. When an application process crashes mid request behind Nginx, Nginx notices, and sends your browser a proper 502 page. When the same application is exposed directly with no proxy in front of it, nobody is left to write that page, and your browser gets nothing at all. If you recently removed a reverse proxy or opened an application port to the internet, that is probably why a familiar 502 turned into this.
If You Are a Visitor, Not the Site Owner
Start by finding out whose problem this is. Open the same URL on your phone using mobile data instead of wifi, or check it with our guide to whether a site is down for everyone or just you.
- Fails everywhere: the server is at fault. Nothing on your machine will change it. Wait a few minutes and try again, because crashed workers are often restarted automatically, and let the owner know if it persists.
- Works on your phone: something between your browser and the site is interfering. Work through the steps below.
Turn Off Your VPN or Proxy
A VPN or proxy is itself a relay. If it accepts your connection and then fails to reach the destination, it can close your side with nothing to show for it. Disconnect and reload. If the site works, try a different VPN server location or report it to the VPN provider.
Disable Antivirus Web Protection
Security suites that inspect web traffic sit in the middle of every connection. When their filtering engine errors on a particular page, some of them drop the response instead of passing it through. Temporarily disable the web shield or HTTPS scanning feature and reload. If that fixes it, add the site as an exception rather than leaving protection off.
Try Incognito, Then Clear Browsing Data
An Incognito window runs without most extensions and without your cookies. If the page loads there, an extension or an oversized cookie is the culprit. Some servers close the connection when request headers exceed their limit, and a site that has set dozens of cookies can push you over it. Clear cookies for that one site first, then disable extensions one at a time.
Reset the Network Stack on Windows
If every site gives intermittent empty responses, not just one, a broken network driver or a leftover filter from uninstalled security software may be the cause. Run these in an administrator command prompt, then restart:
netsh winsock reset
netsh int ip reset
On a Mac, the equivalent is removing and re-adding the network service under System Settings, then restarting.
What will not help:
Flushing DNS, changing DNS servers to 1.1.1.1 or 8.8.8.8, and fixing your system clock. Your browser already found the server and connected to it, so none of those steps touch the part that failed. If the site fails on mobile data too, stop troubleshooting your computer entirely.
Diagnose It in Three Steps
If you own the site, the browser has told you all it knows. curl and your server logs will tell you the rest.
Step 1: Reproduce It With curl
curl -v https://example.com/A reproduction looks like this. The request goes out, and the next line is the failure:
* Connected to example.com (203.0.113.10) port 443
> GET / HTTP/1.1
> Host: example.com
> User-Agent: curl/8.5.0
> Accept: */*
>
* Empty reply from server
curl: (52) Empty reply from server
If curl gets a normal response while Chrome still fails, the problem is on the client side, or it depends on something your browser sends and curl does not, such as cookies. If it fails for one URL and not another, write down both, because the difference points straight at the cause.
Step 2: Find the Pattern
A single request tells you it happens. Twenty tell you how:
for i in $(seq 1 20); do
  curl -s -o /dev/null -w "%{http_code} %{time_total}s\n" https://example.com/slow-page/
done
An empty reply prints as 000. Read the output against this table:
| Pattern | What It Suggests | Go To |
|---|---|---|
| Some requests fail, some succeed, on the same URL | A worker process is crashing or being killed | Cause 1 |
| Failures always arrive after the same number of seconds | A timeout is killing the request | Cause 1 |
| Every request fails instantly, every time | The server is closing the connection on purpose | Cause 2 |
| Works with the domain name, fails with the IP, or the reverse | A default server block is catching the request | Cause 2 |
| Works from inside the server or container, fails from outside | The application is listening on the wrong interface | Cause 3 |
Step 3: Read the Logs at the Moment It Happened
Run your failing curl command, note the time, and then look at what the server wrote at that second. These are the places that matter:
# Did the kernel kill a process for running out of memory?
sudo dmesg -T | grep -iE "out of memory|killed process"

# Nginx error log
sudo tail -n 50 /var/log/nginx/error.log

# Apache error log (Debian and Ubuntu path shown)
sudo tail -n 50 /var/log/apache2/error.log

# PHP-FPM, adjust the version to match yours
sudo journalctl -u php8.3-fpm --since "10 minutes ago"

# Any systemd service, such as a Node or Python app
sudo journalctl -u myapp --since "10 minutes ago"
An empty response almost never leaves a matching line in the access log, because the request never finished. The evidence is in the error log, the service log, or the kernel log. If all three are silent, that is a clue too, and it points toward cause two.
Cause 1: The Process Handling the Request Died
This is the most common cause by a wide margin. The web server or application accepted the connection, handed the request to a worker process, and that worker was gone before it wrote a response. The operating system closes the socket as the process exits, and your browser sees a clean close with nothing in it. The signature is intermittent failure: most requests work, some do not, and the heavy pages fail most.
Killed for Running Out of Memory
When a server runs out of RAM, the Linux kernel picks a process and kills it. On a web server that is usually the largest worker, which is usually the one handling your most expensive request. The kernel log records it plainly:
Out of memory: Killed process 48213 (php-fpm8.3) total-vm:1024880kB, anon-rss:612344kB
The fix is to make the numbers add up. Multiply the number of workers you allow by the memory each one uses at peak, and that total has to fit in your RAM with room left for the database and the operating system. For PHP-FPM, check the average worker size and lower pm.max_children to fit:
# Average resident memory per PHP-FPM worker, in MB
ps -C php-fpm8.3 -o rss= | awk '{sum+=$1; n++} END {print sum/n/1024 " MB"}'
With 2 GB of RAM, 1 GB reserved for everything else, and workers averaging 80 MB, a safe pm.max_children is about 12. Setting it to 50 is how servers get into this state. Adding swap buys time but not a fix, since a server that swaps heavily becomes slow enough to fail in other ways. On shared hosting, the equivalent is the hosting limit described in our guide to 508 Resource Limit Is Reached.
Segmentation Faults
A worker that crashes outright leaves a line like one of these:
# PHP-FPM
WARNING: [pool www] child 31877 exited on signal 11 (SIGSEGV) after 212.402 seconds from start

# Apache
AH00052: child pid 9921 exit signal Segmentation fault (11)
Signal 11 means the process tried to read memory it did not own, which is a bug in compiled code rather than in your PHP or Python. The usual suspects are a PHP extension (OPcache with a corrupted cache, an outdated ionCube loader, Xdebug left enabled in production, or an image library such as Imagick), an Apache module, or a mismatch after a partial upgrade. Work through them in that order: restart PHP-FPM to clear OPcache, then disable recently added or updated extensions one at a time with php -m as your list. If the crash follows a single URL, that URL is exercising the broken extension.
Application Server Timeouts
Application servers kill workers that take too long, and a killed worker cannot send an error page. If your failures always arrive after the same number of seconds in the step two loop, look for this. Gunicorn's default timeout is 30 seconds and it logs the kill:
[CRITICAL] WORKER TIMEOUT (pid:18244)
PHP-FPM does the same with request_terminate_timeout, and Apache's mod_reqtimeout can close slow client connections. Raising the timeout hides the problem. The real fix is finding the slow request: an unindexed database query, a call to an external API with no timeout of its own, or a report that should run as a background job instead of inside a web request. The loop in step two, pointed at the slow URL, tells you exactly how slow it is.
Node.js and Other Single Process Apps
A Node.js server runs your whole application in one process. An uncaught exception or an unhandled promise rejection in any request handler takes the process down, and every request in flight at that moment gets an empty response. If a process manager such as systemd or PM2 restarts it, the next requests work again, which makes the failure look random. Check the restart count with pm2 list or systemctl status myapp. A restart count that keeps climbing is the crash, and the stack trace just before each restart in the logs is the bug.
Cause 2: The Server Is Closing the Connection on Purpose
If every request fails instantly and your error logs are quiet, nothing crashed. Something was configured to hang up. This is by design in several common setups, and it becomes a problem when a legitimate request falls into the trap.
Nginx Return 444
Nginx has a special non standard status code, 444, which tells it to close the connection without sending anything. It is a popular way to ignore bots and scanners that hit a server by IP address, and it appears in countless hardening guides as a catch all block:
server {
    listen 80 default_server;
    server_name _;
    return 444;
}
That block catches every request whose Host header does not match any other server_name. So when you add www.example.com in DNS but only example.com in Nginx, or point a new domain at the server before configuring it, visitors land in the catch all and get an empty response. Unlike a crash, Nginx does log it, with 444 as the status:
# Find recent 444 responses and the hostnames that triggered them
sudo awk '$9 == 444' /var/log/nginx/access.log | tail -n 20

# List every server_name Nginx actually loaded
sudo nginx -T 2>/dev/null | grep -E "^\s*server_name"
Add the missing hostname to the right server block, run sudo nginx -t && sudo systemctl reload nginx, and test again. The $9 field assumes the default combined log format. If you use a custom format, find the status column first.
Security Plugins, WAFs, and Hosting Protection
Most firewalls and security layers block with a 403 page or silently drop traffic, which produces a 403 Forbidden or a timeout rather than this error. Some bot protection and rate limiting systems close the connection instead, especially on shared hosting. If the error hits only certain visitors, only after many requests, or only from one office network, suspect a block on the IP address. Look in your hosting panel's security or firewall section for blocked IPs, or ask support directly whether their protection closes connections without a response. If you run fail2ban, check sudo fail2ban-client status for jails that may have caught a real user.
Oversized Request Headers
Some servers and proxies close the connection when request headers exceed a size limit instead of returning 431 Request Header Fields Too Large. This is the one server cause where clearing cookies in the browser is a real fix, and the tell is a site that fails for long time visitors while working in Incognito. Reduce what the application stores in cookies, or raise the limit, for example with large_client_header_buffers 4 16k; in Nginx.
Cause 3: The Application Is Listening on the Wrong Interface
This cause is almost exclusively a Docker and development server problem, and it is the source of a large share of "Empty reply from server" questions from developers. The signature is unmistakable: the app responds to curl run inside the container or on the server itself, and returns nothing from anywhere else.
When you publish a port with docker run -p 8080:3000, Docker accepts connections on port 8080 of the host and forwards them into the container on port 3000. If the application inside is listening on 127.0.0.1, it only accepts connections from inside the container itself. Docker's forwarder accepted your connection, found nobody to hand it to, and closed it. Your browser reports that as an empty response rather than a refused connection, because from its point of view something did answer.
Confirm it by checking what address the app is bound to inside the container:
docker exec -it mycontainer sh -c "ss -tlnp || netstat -tlnp"

# Broken: only reachable from inside the container
LISTEN  0  511  127.0.0.1:3000  0.0.0.0:*

# Working: reachable through the published port
LISTEN  0  511  0.0.0.0:3000    0.0.0.0:*
The fix is to bind to all interfaces. Common frameworks default to localhost, so the change is usually one flag:
| Framework | Default That Breaks | Fix |
|---|---|---|
| Flask | flask run binds 127.0.0.1 |
flask run --host=0.0.0.0 |
| Django dev server | runserver binds 127.0.0.1 |
runserver 0.0.0.0:8000 |
| Vite | Binds localhost | vite --host |
| Node.js | listen(3000, "127.0.0.1") |
listen(3000, "0.0.0.0") |
| Gunicorn | Binds 127.0.0.1:8000 | gunicorn --bind 0.0.0.0:8000 app:app |
The second version of the same mistake is a port mismatch: publishing -p 8080:3000 when the app actually listens on 8000. Docker still accepts on 8080 and still has nothing to forward to. Compare the right hand side of your port mapping with the port in the ss output.
Production note: development servers like flask run and Django's runserver are not built for public traffic. Binding them to 0.0.0.0 fixes this error, but in production put a real application server such as Gunicorn behind Nginx, and bind the application to localhost so only Nginx can reach it.
Cloudflare, Load Balancers, and Proxies
A proxy in front of your site changes what visitors see, because the proxy is the one receiving the empty response, and it has a page of its own to show instead.
-
Cloudflare: an empty response from your origin becomes Cloudflare error 520, "Web server is returning an unknown error". Cloudflare lists an empty response as one of 520's specific causes. The fixes in this guide apply unchanged. Test your origin directly with
curl -v --resolve example.com:443:YOUR_ORIGIN_IP https://example.com/to see the empty reply Cloudflare saw. -
Nginx or Apache as a reverse proxy: the visitor gets a 502 Bad Gateway, and the Nginx error log shows
upstream prematurely closed connection while reading response header from upstream. That line is the empty response, logged by the proxy. - AWS load balancers: an Application Load Balancer typically returns a 502 when a target closes the connection without responding.
So if visitors see ERR_EMPTY_RESPONSE on a site behind Cloudflare, the empty response is not coming from your origin. Check whether the hostname is actually proxied (orange cloud) and whether a local VPN or antivirus is involved, because Cloudflare itself almost always sends a page.
How to Stop It From Happening Again
ERR_EMPTY_RESPONSE has an awkward property: it rarely leaves evidence where site owners look. There is no line in the access log, no error page to screenshot, and in the crashing worker case the process manager quietly restarts everything, so the site looks healthy by the time anyone checks. Visitors do not report it either. They assume the site is broken and leave.
Monitor From Outside
An external uptime monitor sends a real HTTP request on every check. An empty reply has no status code, so the check fails and you get alerted with a timestamp you can match against your kernel and service logs. That timestamp is the most valuable part, because it tells you which minute of logs to read, which is exactly the step that is hard to do after the fact.
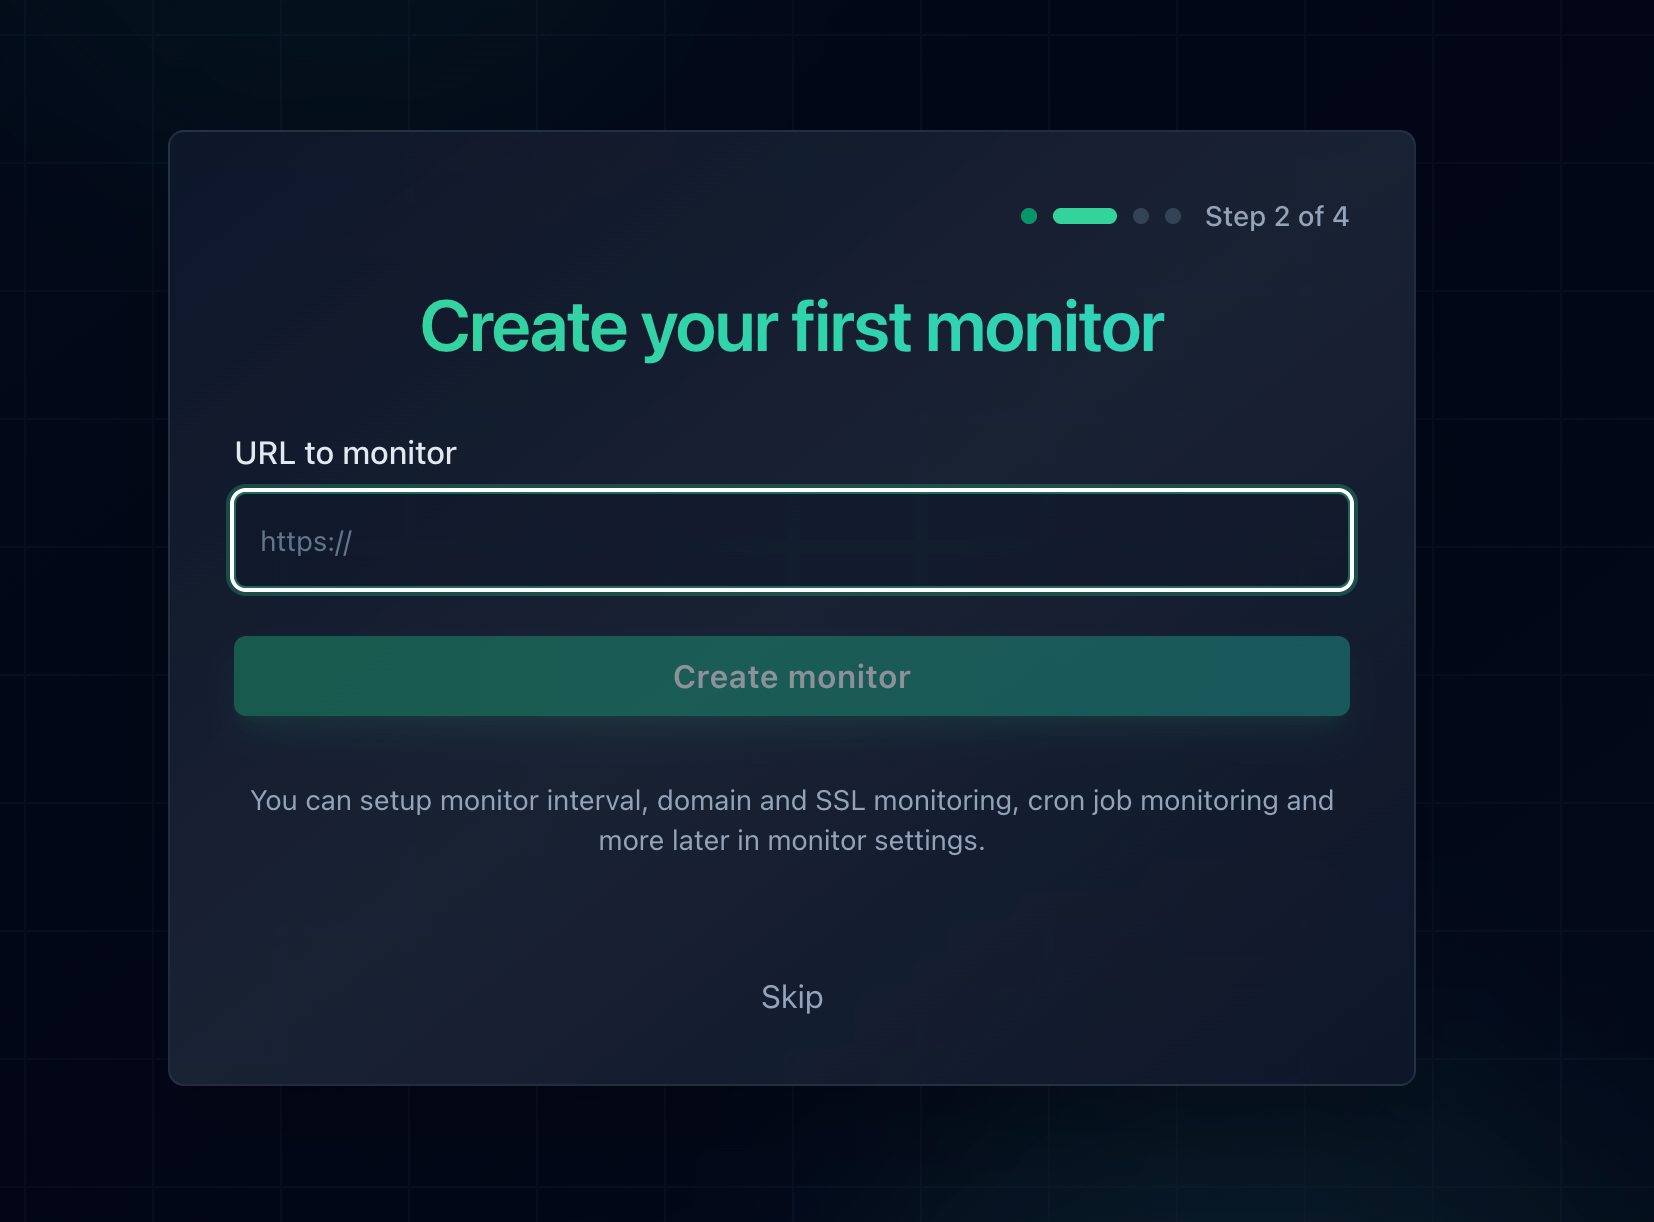
Add the URL and every check sends a full HTTP request and expects a real response.
Monitor the Heavy Pages, Not Just the Homepage
Crashes and memory kills happen on expensive requests: search, checkout, reports, admin dashboards. A cached homepage can keep answering perfectly while those pages fail. Add a monitor for one or two of your heaviest public URLs alongside the homepage, and watch their response times. A slow page that keeps getting slower is often a worker timeout waiting to happen, as covered in our guide to monitoring website response time.

A failed check shows up immediately on the dashboard, with the exact time it started.
Get the Alert Where You Will See It
Notifier sends email, SMS, phone call, and Slack alerts on every plan, including the free tier, plus a recovery alert when the site comes back so you know how long it lasted. SSL certificate and DNS monitoring are included free on every plan too. If you get stuck setting it up, the support team usually replies within minutes through the chat widget or support@notifier.so.
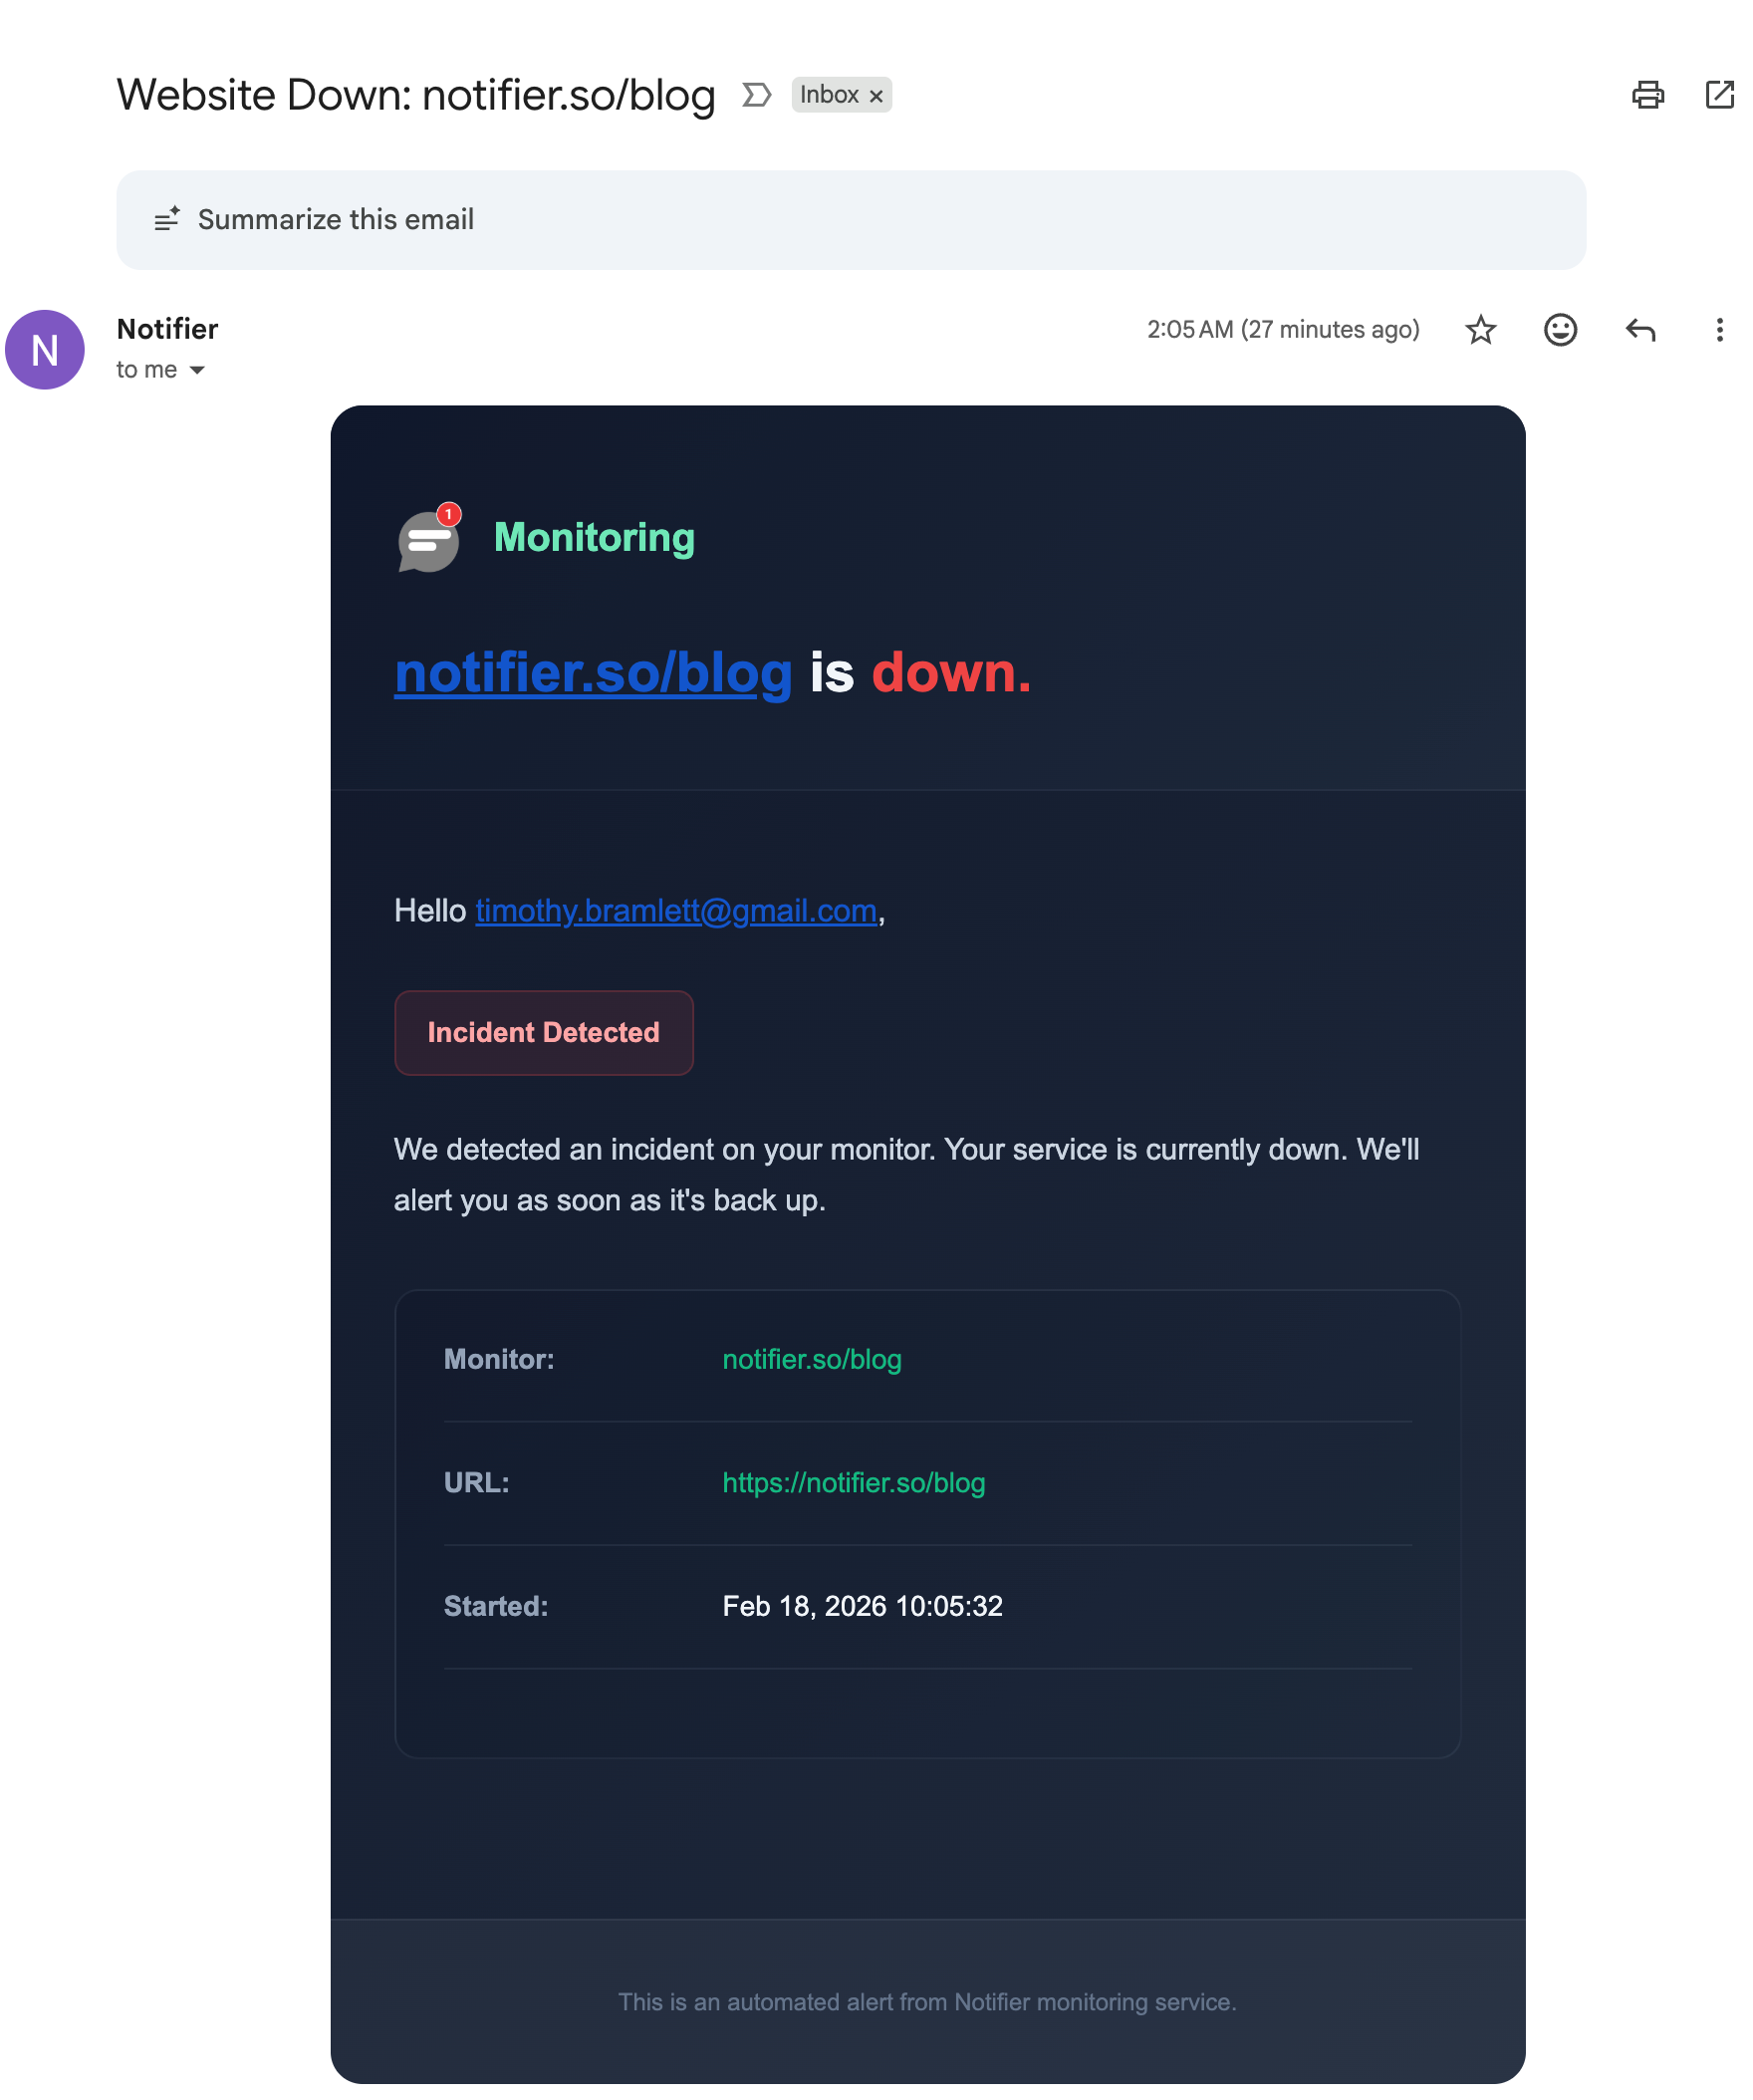
The alert email includes the time the incident started, so you know which logs to read.
How the Common Tools Compare
For intermittent failures like this one, check frequency matters most, followed by where the alerts can go. Here is how the usual options compare on their free plans:
| Tool | Free Plan | SSL Monitoring | Notes |
|---|---|---|---|
| Notifier | 10 monitors, 5 min checks, 5 status pages | Free on every plan | Email, SMS, phone, and Slack alerts on free. Commercial use allowed. Solo is $4/month for 20 monitors at 1 minute. |
| UptimeRobot | 50 monitors, 5 min checks, 1 status page | Included | Free plan is non-commercial only. SMS and voice sold as credits. |
| Better Stack | 10 monitors, 3 min checks, 1 status page | Included | Strong incident management, but pricing is per responder and adds up quickly for a team. |
| StatusCake | 10 monitors, 5 min checks | 1 SSL monitor on free | Status pages are a separate paid product, and SMS uses paid credits. |
| Uptime Kuma | Unlimited, self-hosted | Included | Free and flexible, but if it runs on the same server that is crashing, it goes down with it. |
Important: UptimeRobot restricted its free plan to non-commercial use only in October 2024. If the site belongs to a business or a client, that free tier is not an option. Notifier's free tier has no such restriction.
Pricing changes, so verify before committing. Our comparison of free website monitoring tools covers each free tier in detail, how to set up website monitoring walks through setup in about five minutes, and if your site fails repeatedly, why your website keeps going down covers the patterns behind recurring outages.
Frequently Asked Questions
What does ERR_EMPTY_RESPONSE mean?
It means your browser connected to the website's server and sent its request, and the server closed the connection without sending any response at all. No status code, no headers, no page. DNS worked and something was listening on the port, so the problem is almost always that the process handling the request crashed, was killed, or was configured to hang up.
How do I fix ERR_EMPTY_RESPONSE in Chrome?
First check the site on your phone using mobile data. If it fails there too, the website is at fault and you can only wait or contact the owner. If it works, turn off your VPN or proxy, disable your antivirus web protection, and try an Incognito window to rule out extensions and cookies. If every site fails, reset the Windows network stack with netsh winsock reset and restart. Flushing DNS will not help, because DNS already worked.
What is the difference between ERR_EMPTY_RESPONSE and ERR_CONNECTION_RESET?
Both mean the connection ended without a page, but they end differently. ERR_CONNECTION_RESET means the connection was torn down abruptly with a TCP reset, often by a firewall, a middlebox, or a network problem. ERR_EMPTY_RESPONSE means the server closed the connection normally after receiving your request, without writing anything. An empty response points more strongly at the server's own software, such as a crashed worker or an Nginx 444 rule.
What does curl (52) Empty reply from server mean?
It is curl's name for the same failure Chrome calls ERR_EMPTY_RESPONSE. curl connected and sent the request, and the server closed the connection before sending a status line. If it happens against a Docker container, check that the application inside is listening on 0.0.0.0 rather than 127.0.0.1 and on the port your mapping forwards to. On a regular server, check the kernel log for out of memory kills and the service logs for crashed workers.
Why does ERR_EMPTY_RESPONSE only happen sometimes?
Intermittent empty responses almost always mean worker processes are dying under load. The most common reasons are the server running out of memory and the kernel killing the largest worker, an extension such as OPcache or Imagick causing segmentation faults, and application server timeouts killing slow requests. A process manager restarts the worker, so the next request works and the site looks healthy. Check dmesg for killed processes and your PHP-FPM or application logs at the exact time of a failure.
Can Nginx cause ERR_EMPTY_RESPONSE on purpose?
Yes. The Nginx directive return 444 closes the connection without sending a response, and it is commonly used in a default server block to ignore requests for unknown hostnames. If a hostname such as www.example.com points at the server but is missing from every server_name directive, those visitors fall into the default block and get an empty response. Search your access log for status 444 and add the missing hostname.
Is ERR_EMPTY_RESPONSE a virus or a problem with my computer?
Rarely. In most cases the website's server is responsible. It can be caused locally by a VPN, a proxy, or security software that inspects web traffic, and in those cases the site loads normally on another device or network. If every website gives you this error, a leftover network filter from uninstalled security software is more likely than malware, and resetting the network stack usually clears it.
Will uptime monitoring detect an empty response?
Yes. An uptime monitor sends a real HTTP request, and an empty reply has no status code, so the check fails and triggers an alert. For intermittent failures, monitor your heaviest pages as well as the homepage and use a short check interval. Notifier checks every 5 minutes on the free plan and every minute on the $4/month Solo plan, with email, SMS, phone call, and Slack alerts, and the alert timestamp tells you exactly which logs to read.