At a Glance
- •"508 Resource Limit Is Reached" means your hosting account, not the server, ran out of an allowance your host set for it. On cPanel and CloudLinux hosting the request is refused before your code runs, so nothing in WordPress, your theme, or your plugins is broken the way the page implies.
- •The limit you hit is usually Entry Processes, which caps how many PHP requests can run at the same instant, typically at 20. It is a concurrency limit rather than a memory limit, which is why plans that add RAM often change nothing.
- •Concurrency equals requests per second multiplied by average response time, so a slow site hits the cap at a fraction of the traffic a fast one handles. Going from a 2 second response time to 0.5 seconds cuts concurrent processes by four at identical traffic.
- •Open cPanel Resource Usage and read the Faults column, not the graphs. A fault lasts seconds and vanishes into a 24 hour average that still reads 12% CPU. Then fix in order: page caching, bot filtering, wp-cron, the slow page.
- •508s strike at your busiest minute and clear before you look, so they run unreported for weeks. A monitor catches the status code on the next check. Notifier is free for 10 monitors with SSL and DNS monitoring included, and paid plans start at $4/month for 1-minute checks.
Resource Limit Is Reached: the website is temporarily unable to service your request as it exceeded resource limit is the error your host shows when your account, rather than the server, ran out of something. Every other site on that machine is loading fine. Yours is not.
Almost every article about this error gives the same three pieces of advice: deactivate your plugins, optimize your images, upgrade your plan. Two of those rarely help, and the third usually helps for the wrong reason. The problem is that "resource limit" is not one limit. It is six or seven separate allowances, each with its own cause and its own fix, and your host puts them all behind one generic message.
This guide starts by identifying which limit you actually hit, because that single answer eliminates most of the standard advice. If you do not run the site, skip to the visitor section. It is short.
What a 508 Resource Limit Error Actually Means
On shared and reseller hosting, your account does not get the whole server. It gets a container with caps on CPU, memory, disk activity, and how many things can run at once. On the large majority of cPanel hosts that container is a CloudLinux LVE, short for Lightweight Virtual Environment, and the Apache module that puts each request inside it is mod_hostinglimits.
When a request arrives and the module cannot fit it into your container, it does not queue the request and it does not run your code. It returns 508 immediately. That timing is the most useful fact in this guide, and three things follow from it:
- Your code never ran. No PHP was executed, no database query was issued, no plugin was loaded. Deactivating plugins one at a time, the standard WordPress debugging ritual, is testing something that was never involved in the failure.
- The server is healthy. A 508 is proof that Apache or LiteSpeed accepted the connection and was working well enough to enforce a policy. Checking your host's status page is wasted effort.
- It is your busiest moment, by definition. Limits are hit under load. That is why the error is nearly always gone by the time you open the site to look, and why it can run for weeks before anyone reports it.
The naming confusion worth clearing up first:
In the HTTP specification, 508 means "Loop Detected" and comes from RFC 5842, a WebDAV extension. It has nothing to do with hosting resources. cPanel and CloudLinux borrowed the number because it was unused, so searching for the official meaning of HTTP 508 leads you into WebDAV documentation that will not help you. If you are seeing this error on a normal website, the resource limit meaning is the one that applies. The genuine Loop Detected case is covered in the FAQ.
Which Limit You Hit Decides the Fix
Here are the limits your container has, what each one governs, and what happens when you reach it. Note the last column, because it explains why a site can be unbearably slow for an hour and never show a 508, and why another site can throw 508s while its CPU graph looks calm.
| Limit | What It Caps | Typical Shared Value | What Happens at the Cap |
|---|---|---|---|
| Entry Processes (EP) | How many web requests can be inside your account at the same time | 20 | Instant 508 |
| CPU (SPEED) | Processor time, where 100% means one full core | 100% to 200% | Throttled, so pages get slow |
| Physical Memory (PMEM) | RAM used by all your processes together | 1 GB | Process killed, usually a 500 |
| Processes (NPROC) | Every process you own, including cron, SSH, and mail | 100 | Fork failures, 500 or 508 |
| I/O | Disk throughput in KB per second | 1024 KB/s to 8192 KB/s | Throttled, so pages get slow |
| IOPS | Disk operations per second, regardless of size | 1024 | Throttled, so pages get slow |
Read the last column again. CPU and disk limits throttle. They make your site crawl, they do not refuse it. Only Entry Processes and, less often, the process count actually turn a visitor away with a 508.
That has a consequence people miss constantly. The two failure modes chain together. You hit the CPU limit, so every page that used to take 0.4 seconds now takes 3 seconds, so requests pile up inside your account waiting to finish, so you blow through the Entry Process cap and start returning 508s. The CPU limit is the cause. The 508 is the symptom two steps downstream. Fix the CPU problem and the 508 disappears without ever touching the Entry Process setting.
508 Compared to 500, 502, 503, and 504
These five errors get treated as interchangeable "the site is broken" codes. They are not. Each one tells you how far the request got before it died, and that narrows where to look.
| Error | Meaning | Did Your Code Run? | Where to Look |
|---|---|---|---|
| 508 | Your account hit a hosting limit | No | cPanel Resource Usage, traffic and bot logs |
| 500 | Your code failed or was killed | Yes, and it crashed | PHP error log, memory limits, .htaccess |
| 502 | A proxy got an invalid reply from the backend | Started, then died | PHP-FPM pool, upstream service, proxy config |
| 503 | The server is deliberately refusing right now | No | Maintenance mode, PHP-FPM queue, server load |
| 504 | The reply took longer than the timeout allowed | Yes, and it is still running | Slow queries, external API calls, long imports |
The 503 row is the one to watch, because some LiteSpeed based hosts return a 503 for exactly the situation that produces a 508 elsewhere. If you are on LiteSpeed and seeing 503s that correlate with your traffic peaks, read this guide rather than the 503 one. The distinction that matters is not the number on the page, it is whether the failure follows your traffic curve.
If You Are a Visitor, Not the Site Owner
There is nothing on your end to fix, and this is one of the few errors where that statement is completely unqualified. Clearing your cache, flushing DNS, switching resolvers, disabling your VPN, and restarting your router are all irrelevant, because the site's hosting account refused the request before any of your local state mattered.
What does work is waiting. Resource limits reset continuously, and a 508 usually clears within a minute or two once the traffic spike passes. Reloading after sixty seconds succeeds more often than not. If the error persists for hours, the site has a sustained problem and only its owner can fix it. Telling them is genuinely useful, because as the prevention section explains, most owners have no idea it is happening.
Diagnose It in Three Steps
Step 1: Read the faults, not the averages
Open cPanel and find Resource Usage, sometimes labelled CPU and Concurrent Connection Usage. This page is provided by the CloudLinux LVE Manager and it is the only authoritative source for which limit you hit. Everything else is guessing.
Switch the view to the last 24 hours and look at the Faults column, not the usage graphs. A fault is one recorded moment where you touched a cap. This distinction is the single most common reason people misdiagnose the error:
Why the graph says everything is fine:
A 508 event lasts seconds. Averaged across 24 hours it contributes almost nothing, so your CPU graph shows a comfortable 11% while your customers were seeing errors at 2pm. Never conclude from a low average that you have headroom. A single row reading "EP: 342 faults" and "CPU: 0 faults" tells you more than every graph on the page, and it points at concurrency rather than processing power.
Most LVE Manager installations also have a Snapshots tab. When a fault occurs, the system records the processes that were running at that instant. This is the closest thing to a smoking gun that shared hosting offers, and it is the feature almost nobody uses. Open a snapshot from a fault timestamp and you will usually see either twenty copies of the same PHP script, which points at concurrency, or one long running process eating everything, which points at a cron job or an import.
Step 2: Confirm the status code from outside
Before changing anything, verify you are actually getting a 508 and not a 500 or 503 wearing a similar error page:
curl -s -o /dev/null -w "%{http_code}\n" https://example.com/Because the error is intermittent, one request proves nothing. Run fifty and count what comes back:
for i in $(seq 1 50); do
  curl -s -o /dev/null -w "%{http_code} %{time_total}\n" https://example.com/
done | sort | uniq -c | sort -rn
Read the result as a ratio. All fifty returning 508 means a sustained problem such as a stuck process or a genuinely exhausted account. A mix of 200s and 508s means you are riding the concurrency cap, which is the far more common case. Pay attention to the response times on the successful requests too: if the 200s are taking 3 seconds, you have already found your real problem, and it is the throttling described above.
Step 3: Find what is generating the load
Your access log answers this in about thirty seconds. On cPanel it is usually at ~/access-logs/example.com. Start by confirming when the errors happened:
# How many 508s, and in which hour of the day
awk '$9==508 {print $4}' ~/access-logs/example.com | cut -d: -f2 | sort | uniq -c

# The 20 most requested URLs
awk '{print $7}' ~/access-logs/example.com | sort | uniq -c | sort -rn | head -20

# The 20 busiest IP addresses
awk '{print $1}' ~/access-logs/example.com | sort | uniq -c | sort -rn | head -20

# The 20 busiest user agents
awk -F'"' '{print $6}' ~/access-logs/example.com | sort | uniq -c | sort -rn | head -20
The user agent list is the one that surprises people. On a typical small WordPress site today, somewhere between 40% and 70% of requests come from crawlers rather than humans, and they arrive in bursts that look exactly like the traffic spike you have been blaming on your customers.
If you have SSH access, you can also watch your own processes directly:
# Total processes you own, compare against your NPROC limit
ps -u $USER | wc -l

# Concurrent PHP workers, compare against your EP limit
# (use lsphp on LiteSpeed, php-fpm on Apache with FPM)
ps -u $USER -o cmd= | grep -c lsphp

# Your heaviest processes right now
ps -u $USER -o pid,pcpu,pmem,etime,cmd --sort=-pcpu | head -20
That last command is worth running twice, a minute apart. Any process with a large etime value that appears in both runs is stuck, and a handful of stuck PHP workers will hold your Entry Process slots hostage until they time out.
Cause 1: Entry Processes, the Limit Nobody Understands
This is the cause behind most 508s, and it is misunderstood so consistently that it deserves the longest section in this guide.
Entry Processes counts how many web requests are inside your account at the same instant. Not per hour. Not per day. Right now, simultaneously. The typical shared hosting value is 20. When request number 21 arrives while twenty are still running, it is refused with a 508.
Because it is a concurrency limit, it has nothing to do with how much RAM or CPU your plan includes. This is why upgrading from 1 GB to 4 GB of memory so often changes nothing at all, and why the advice to optimize your images is beside the point. Static files usually bypass PHP entirely.
The formula that predicts your 508s
Concurrency is not a property of your traffic alone. It is traffic multiplied by how long each request occupies a slot:
concurrent processes = requests per second x average response time in seconds

10 requests/sec x 0.4s response time =  4 concurrent   (fine)
10 requests/sec x 2.0s response time = 20 concurrent   (at the limit)
10 requests/sec x 3.0s response time = 30 concurrent   (508s)
Identical traffic in all three rows. The only thing that changed is speed. A site serving pages in 400 milliseconds handles five times the traffic of an identical site serving them in 2 seconds, on exactly the same plan, with no upgrade.
This reframes the whole problem. Your 508 is usually a performance bug, not a capacity shortage. Measure where you stand right now:
curl -s -o /dev/null -w "total: %{time_total}s ttfb: %{time_starttransfer}s\n" https://example.com/A time to first byte above one second on shared hosting means you are burning Entry Process slots for no reason. Our guide on monitoring website response time covers how to track that number continuously instead of spot checking it.
Fix 1: Page caching, which does more than everything else combined
Every cache hit is a request that never enters PHP, never takes an Entry Process slot, and never costs you CPU. Turning on full page caching routinely cuts PHP requests by 80% or more on a content site, and it is the closest thing to a single button fix that exists here.
- On LiteSpeed hosting: install LiteSpeed Cache and enable the server level cache. It caches outside PHP, which makes it dramatically more effective than file based plugins.
- On Apache: WP Super Cache or W3 Total Cache, configured to serve cached pages from disk before PHP loads.
- In front of either: a Cloudflare cache rule that caches HTML for logged out visitors moves the request off your server entirely.
Verify it is working rather than assuming. Load a page twice and inspect the headers:
curl -sSI https://example.com/ | grep -iE "x-litespeed-cache|x-cache|cf-cache-status|age"Fix 2: Stop wp-cron from running on page loads
WordPress fires wp-cron.php by having a visitor's page load spawn a second internal request. Two Entry Process slots for one visitor. Under load, when overdue tasks pile up, this turns into a feedback loop where traffic creates cron requests which slow the site which creates more overdue tasks.
Disable it in wp-config.php, above the "stop editing" line:
define('DISABLE_WP_CRON', true);Then add a real cron job in cPanel so scheduled tasks still run. Do not skip this half, or scheduled posts and backups will stop silently:
*/5 * * * * cd /home/USERNAME/public_html && /usr/local/bin/php wp-cron.php >/dev/null 2>&1Scheduled tasks that fail quietly are their own category of problem. Our guide on cron job monitoring covers how to know when they stop running.
Fix 3: Find the slow page
If caching is on and you still hit the cap, the pages that cannot be cached are the culprits: cart, checkout, account, login, and internal search. Install Query Monitor and look at the slowest queries on those specific pages.
One WordPress specific check pays for itself often enough to be worth running blind. Autoloaded options are read from the database on every single request, and abandoned plugins routinely leave megabytes behind:
SELECT ROUND(SUM(LENGTH(option_value))/1024/1024, 2) AS autoload_mb
FROM wp_options WHERE autoload = 'yes';

SELECT option_name, ROUND(LENGTH(option_value)/1024, 1) AS kb
FROM wp_options WHERE autoload = 'yes'
ORDER BY LENGTH(option_value) DESC LIMIT 20;
Under 1 MB is healthy. Above 3 MB you are paying that cost on every request including cache misses from bots. Check the second query's results against your installed plugins before deleting anything.
Cause 2: Bots, Crawlers, and Brute Force Traffic
If your user agent list came back full of crawlers, this is your cause, and it is the fastest growing one. Well behaved search engine bots space their requests out. AI training crawlers and scrapers frequently do not, and some ignore robots.txt entirely. Twenty parallel requests from one crawler is exactly your Entry Process limit consumed by traffic that will never buy anything.
The three patterns to look for
- Crawler bursts. One user agent with tens of thousands of requests, concentrated in a few hours. Common offenders include Bytespider, GPTBot, ClaudeBot, Amazonbot, and a long tail of SEO scrapers.
- Login and XML-RPC brute force. Thousands of POSTs to
/wp-login.phpor/xmlrpc.php. These are uncacheable by definition, so every one costs you a full PHP process. - Query string explosions. Requests to
/?s=search or faceted filter URLs generate unique, uncacheable, database heavy pages. A crawler discovering a filter interface can produce hundreds of thousands of them.
What actually stops them
Adding Crawl-delay to robots.txt is the standard advice and it is close to useless. Google ignores the directive, and the crawlers causing you problems are the ones already ignoring the file. Blocking has to happen before the request reaches PHP.
Blocking XML-RPC in .htaccess costs nothing if you do not use the Jetpack app or the WordPress mobile app:
<Files xmlrpc.php>
  Require all denied
</Files>
For everything else, put Cloudflare in front of the site and do the filtering at the edge. The free plan includes what you need here: bot fight mode, and firewall rules that block or challenge by user agent, country, or path. A crawler blocked at Cloudflare never touches your Entry Process limit. If you take this route, our guides on the Cloudflare 522 and 524 errors cover the new failure modes proxying introduces.
Before you block by user agent:
Verify that a bot claiming to be Googlebot really is one. Anyone can send that string, and blocking real Googlebot will cost you rankings. Run a reverse lookup on the IP with host 66.249.66.1 and confirm it resolves inside googlebot.com or google.com, then forward resolve that hostname back to the same IP. Impostors fail this test immediately.
Cause 3: CPU and Disk Throttling
If your Resource Usage page shows CPU or I/O faults rather than Entry Process faults, the mechanism is different. You are not being refused, you are being slowed down, and the 508s are the second order effect described earlier.
CPU faults on a small site nearly always trace to something scheduled rather than something a visitor did:
- Backup plugins running during business hours. A full site backup will saturate both CPU and disk for as long as it runs. Move it to your quietest hour and check whether your host already takes backups you are duplicating.
- Overlapping cron jobs. A job scheduled every five minutes that takes seven minutes to finish will eventually have a dozen copies running at once. Use a lock file, or lengthen the interval.
- Security plugin file scans. Wordfence style scans read every file on disk. That is an IOPS limit event with a name.
- Runaway imports or feed syncs. Product feeds and CSV importers are written on the assumption of a dedicated server.
I/O and IOPS faults have their own reliable causes: unrotated log files that have grown to gigabytes, a session directory containing hundreds of thousands of files, an oversized wp_options table forcing full scans, and mail queues on accounts that also send newsletters. Check the obvious one first:
# Largest directories in your account
du -sh ~/* 2>/dev/null | sort -rh | head -20

# Files over 100 MB
find ~ -type f -size +100M -exec ls -lh {} \; 2>/dev/null
Cause 4: Memory and Process Count
Memory faults behave differently again. When your container exceeds its physical memory allowance, the process is killed outright, and the visitor usually gets a 500 or a blank white page rather than a 508. So if you are seeing memory faults alongside your 508s, treat them as two separate problems that happen to share a trigger.
There is a trap here worth naming. Raising memory_limit in PHP does not give you more memory, it raises the ceiling on how much a single script may request before PHP stops it. If that new ceiling is above your container's allowance, you have simply moved the failure from a clean PHP error you can read in a log to a hard kill you cannot. Keep memory_limit comfortably below your PMEM limit divided by the number of PHP workers you expect to run at once.
The process limit, NPROC, counts everything you own and not just web requests: cron jobs, SSH sessions, mail delivery, backup scripts, and cPanel's own tasks. It is the limit most likely to be hit by something entirely unrelated to your visitors, which is why a 508 can arrive at 3am on a site with no traffic. Compare ps -u $USER | wc -l against the NPROC value shown in Resource Usage while a scheduled job is running.
Should You Just Upgrade Your Hosting Plan?
Sometimes, yes. But upgrading is the most expensive way to test a hypothesis, and hosts recommend it before diagnosis for reasons that are not entirely about your website. Use the limit you identified to decide:
| Fault Type | Does Upgrading Help? | Try This First |
|---|---|---|
| Entry Processes | Only if the plan raises EP specifically | Page caching, then response time. Many upgrades add RAM and leave EP unchanged. |
| CPU | Usually yes | Find the scheduled job first. A backup at noon is not a capacity problem. |
| Memory | Usually yes | Check for one plugin allocating far more than the rest. |
| I/O and IOPS | Sometimes | Log rotation and session cleanup fix this for free more often than not. |
| Bot traffic | No | A bigger plan buys a larger bucket for traffic that has no value. Filter at the edge instead. |
When you do contact your host, ask one specific question rather than reporting that the site is down: "Which LVE limit is my account faulting on, and what are my current EP, NPROC, PMEM, and CPU values?" That question gets a useful answer from a first line support agent. "My site shows a resource limit error" gets you a link to an upgrade page.
And there is an honest version of the upgrade conversation. If your site genuinely sustains meaningful concurrent traffic, caching is on, bots are filtered, and you are still faulting, you have outgrown shared hosting. A small VPS or managed WordPress plan removes the container entirely. The point of the diagnosis is to reach that conclusion with evidence rather than as a first guess.
How to Stop Finding Out From Customers
Resource limit errors have a property that makes them uniquely likely to go unnoticed: they happen exclusively when you are busy, and they resolve on their own. By the time you open the site, it works. The customer who hit the error at 2pm does not file a bug report, they leave. Sites run this way for months.
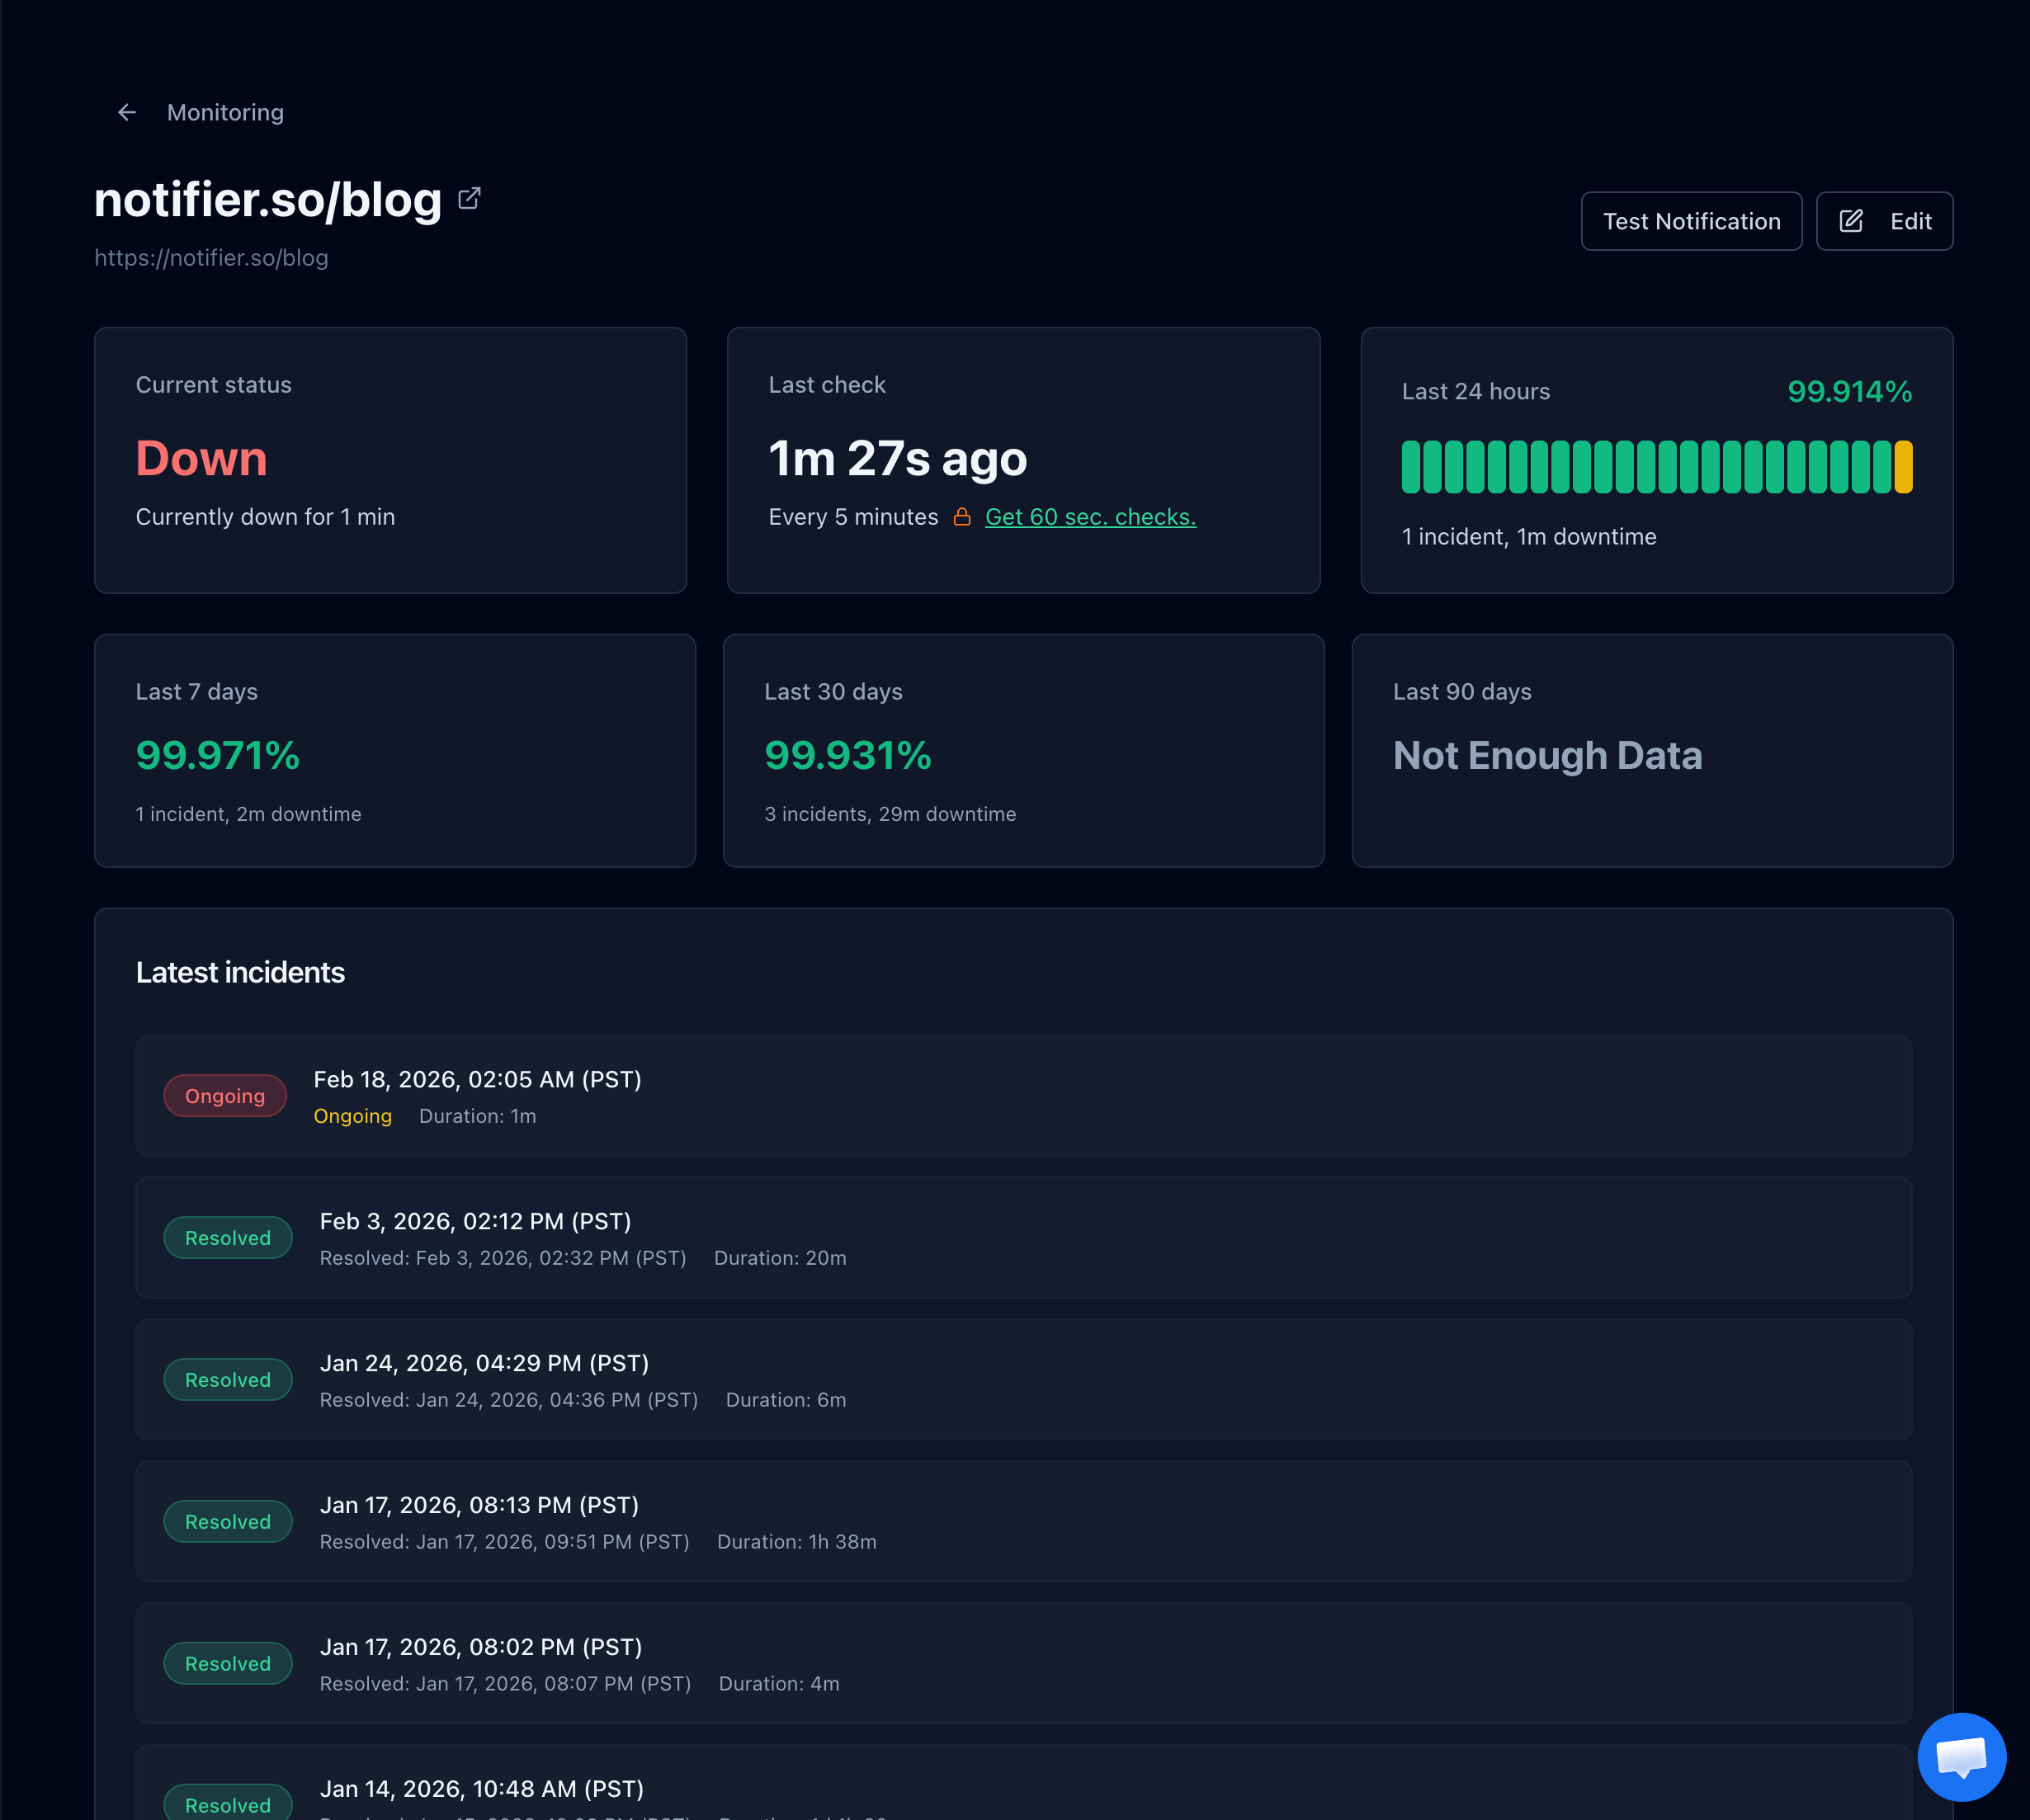
A 508 is a real HTTP status code, not a 200 with an apology on it, so any monitor validating status codes flags it on the next check.
Watch response time, because it warns you first
This is the part specific to resource limits, and it is why monitoring is worth more here than for most errors. CPU and disk caps throttle before anything is refused, so a site heading toward its Entry Process limit shows a rising response time trend for days or weeks before the first 508 appears. That trend is a genuine early warning, and it is visible on a chart long before it is visible to a customer.
Monitor the pages that cannot be cached
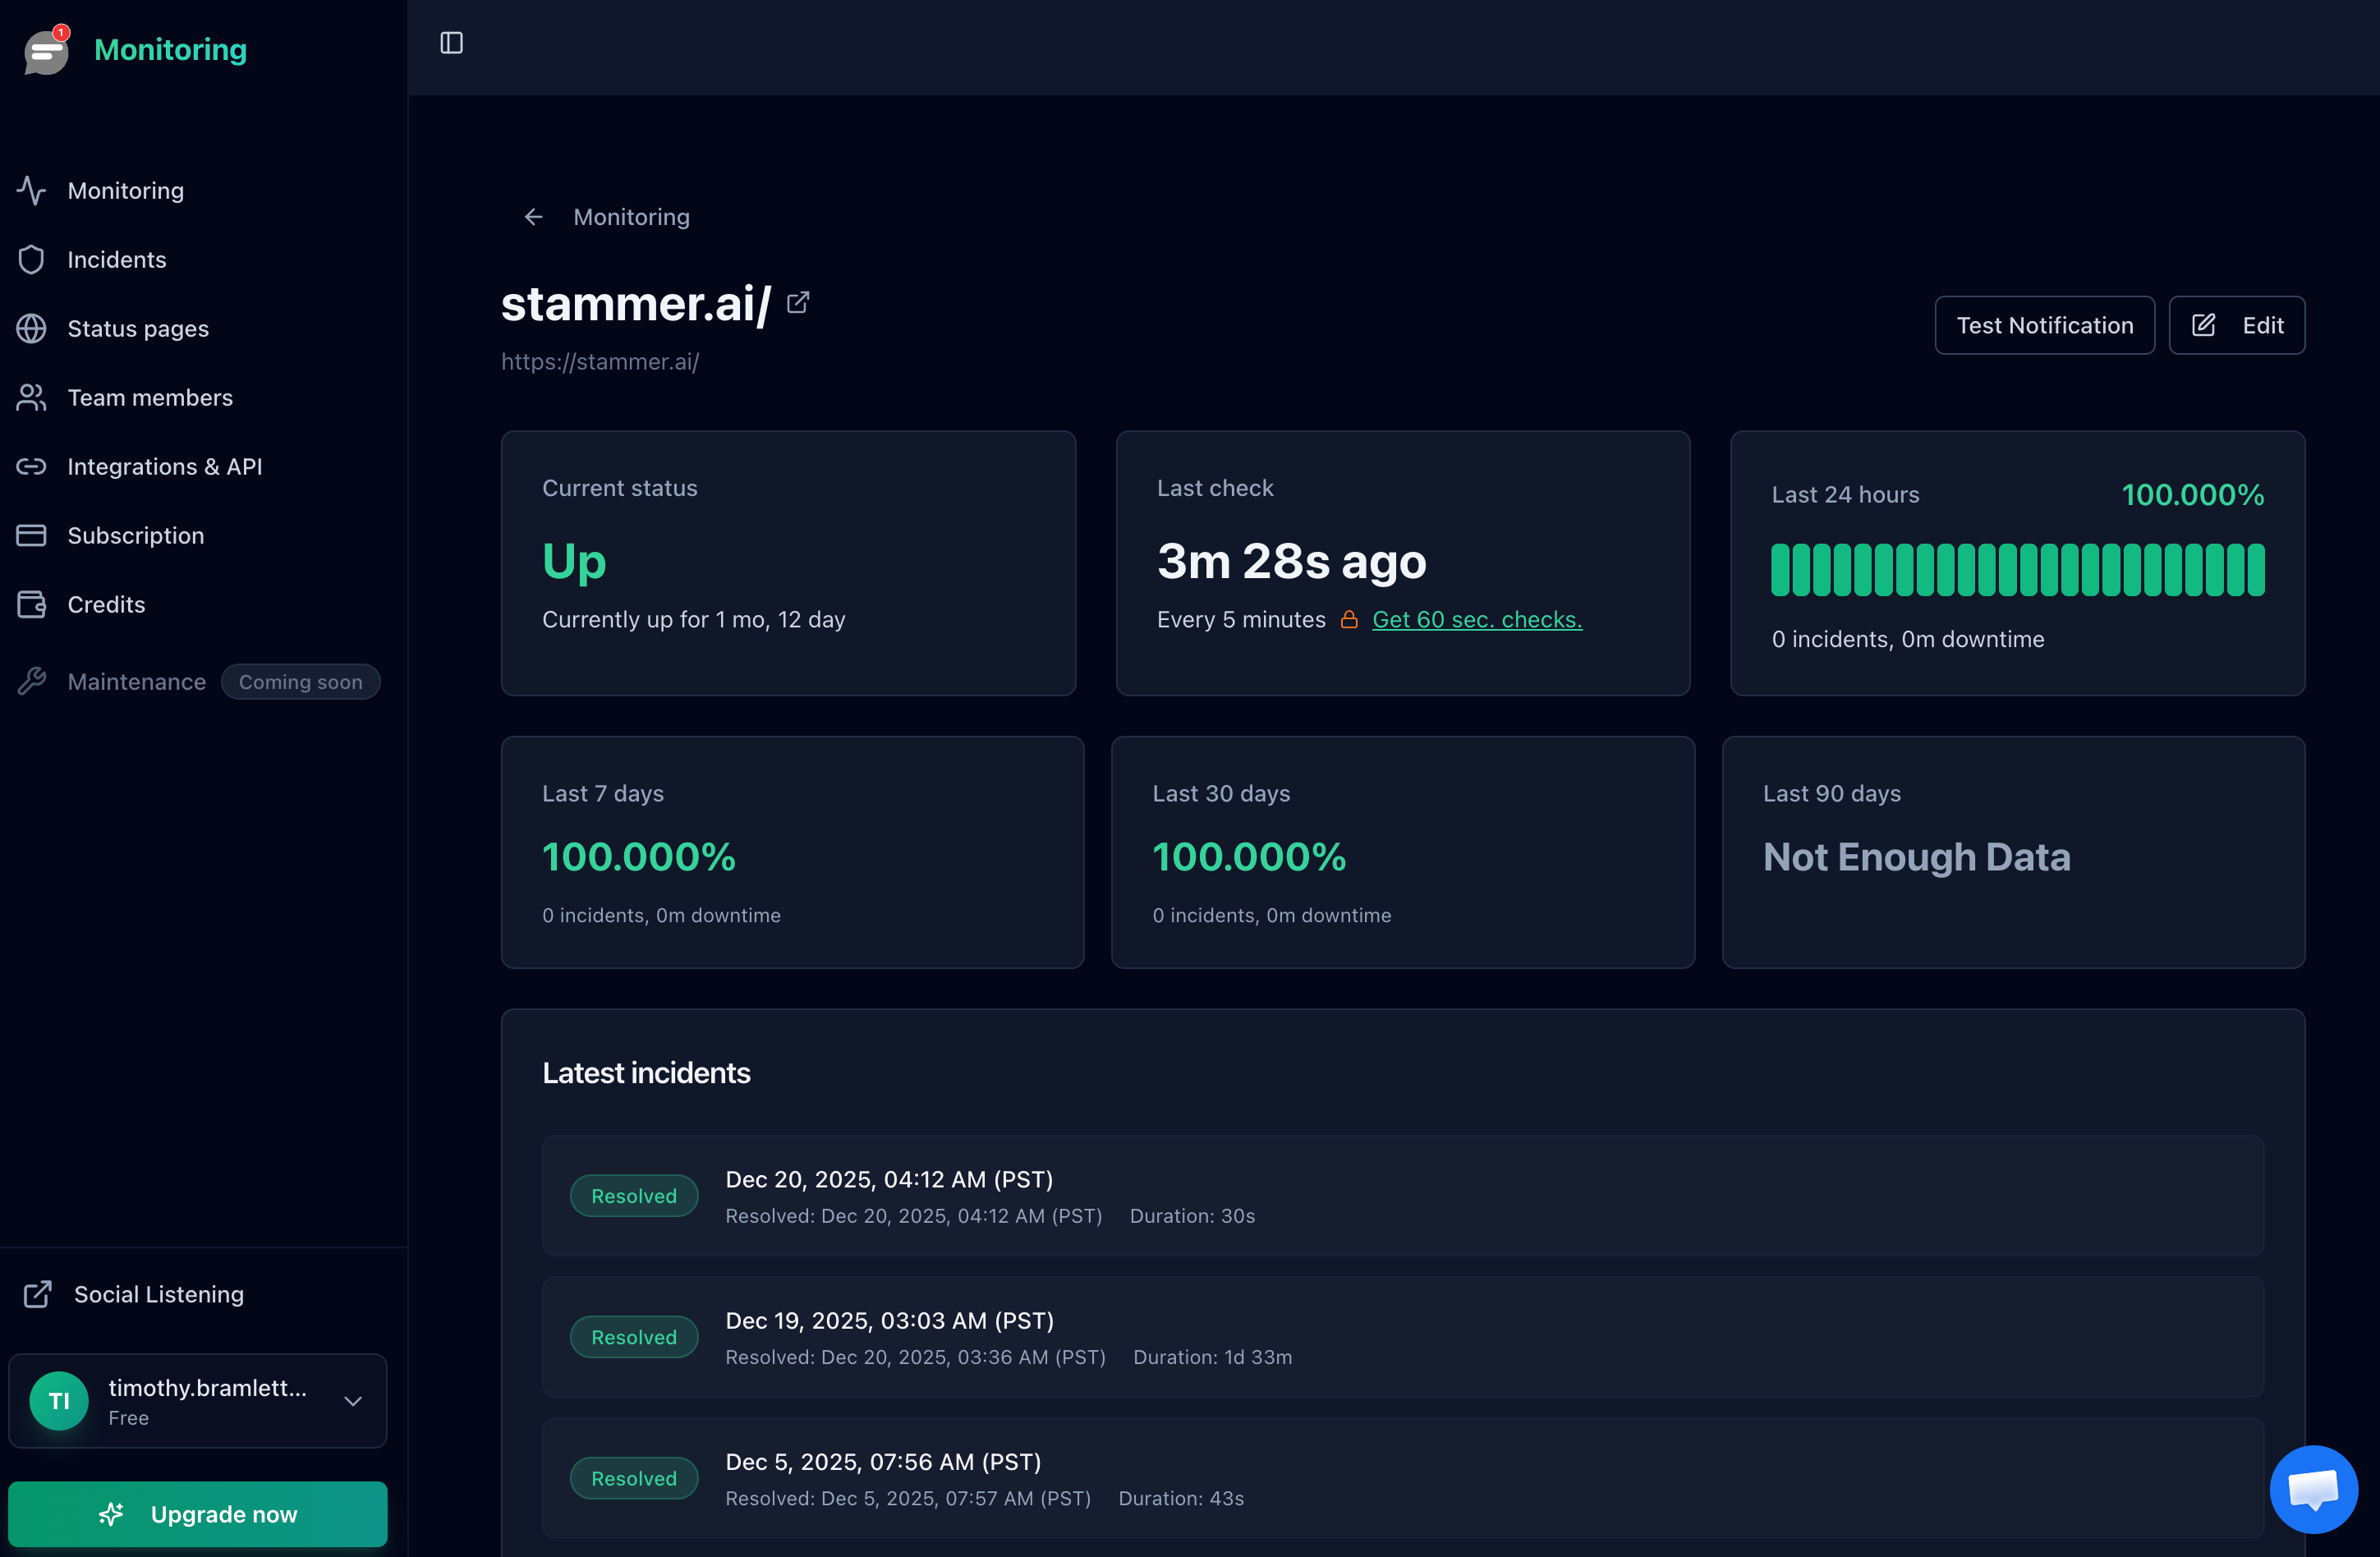
Once caching is enabled, your homepage is served from cache and will keep returning 200 while every uncached page fails. A monitor pointed only at the front door will report perfect uptime through an outage that is costing you every sale. Put separate monitors on cart, checkout, login, and any API path, because those are the requests that consume PHP processes and those are the ones that break first.
Check interval matters more than usual for this error, because a 508 window can be shorter than the gap between checks. A five minute interval will miss brief faults entirely and only catch sustained ones. The website monitoring checklist covers what else belongs alongside uptime, including SSL certificate expiry, which takes sites down just as reliably and with far less warning.
How the common tools compare
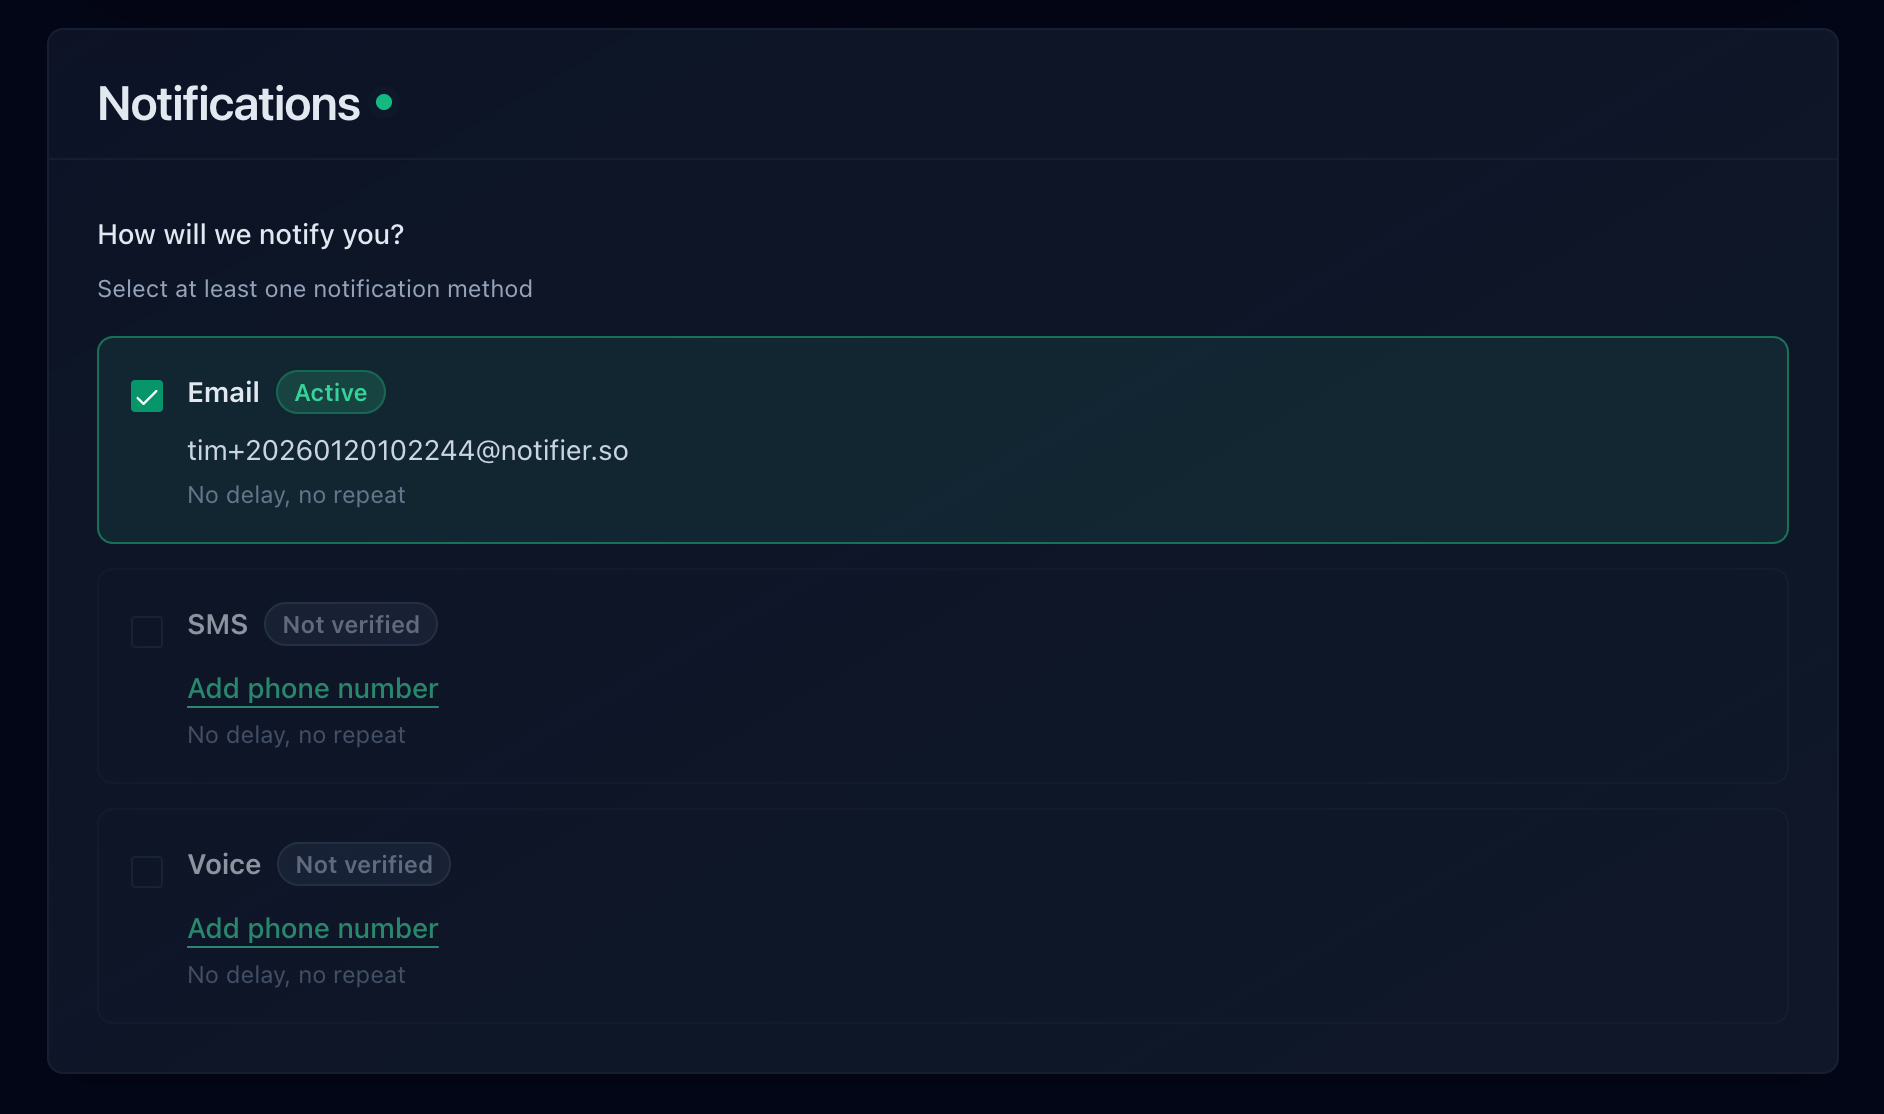
Since detection speed is the whole game with an intermittent error, here is how the free plans line up:
| Tool | Free Plan | Alert Channels on Free | Notes |
|---|---|---|---|
| Notifier | 10 monitors, 5 min checks, 5 status pages | Email, SMS, phone, Slack | SSL and DNS monitoring included on every plan. Free tier is fine for commercial use. Solo is $4/month for 20 monitors at 1 minute. |
| UptimeRobot | 50 monitors, 5 min checks, 1 status page | Free plan is non-commercial only. SMS and voice run on one-time credit bundles. Paid plans start at $8/month for 10 monitors. | |
| Better Stack | 10 monitors, 3 min checks, 1 status page | Email, Slack | Capable incident management, but pricing is per responder at $34/month and climbs quickly for a team. |
| StatusCake | 10 monitors, 5 min checks | Only 1 SSL monitor on free, and status pages are sold separately. The first paid tier is $24.49/month. | |
| Uptime Kuma | Unlimited, self-hosted | Many, via integrations | Free and flexible, but never host it on the account you are monitoring, since the same limits will take the monitor down with the site. |
Important: UptimeRobot restricted its free plan to non-commercial use only in October 2024. If the site hitting resource limits belongs to a business or a client, that free tier is not an option. Notifier's free tier has no such restriction.
Pricing changes, so verify before committing. Our comparison of free website monitoring tools goes through each free tier in detail, and how to set up website monitoring walks through the whole setup in about five minutes. If your site has been faulting for a while rather than once, why your website keeps going down covers the other recurring causes.
Frequently Asked Questions
Is 508 a real HTTP status code?
Yes, but not for this. In RFC 5842, HTTP 508 means "Loop Detected" and applies to WebDAV servers that spot an infinite recursion while processing a request. cPanel and CloudLinux reused the number for resource limit errors because it was otherwise unused on normal websites. Both meanings are now in circulation, which is why searching the specification leaves you more confused than when you started. If you are seeing this on a WordPress site or an online store, it is the resource limit meaning. If you are running a WebDAV or CalDAV server, the loop meaning may genuinely apply, and browser side redirect loops produce a different error covered in our guide to ERR_TOO_MANY_REDIRECTS.
Will upgrading my hosting plan fix the 508 error?
It depends entirely on which limit you hit, which is why diagnosis comes first. CPU and memory faults usually improve with a bigger plan. Entry Process faults often do not, because many hosts increase RAM and CPU between tiers while leaving the concurrency limit identical. Bot driven faults never improve, since a larger allowance simply gives worthless traffic more room. Check the Faults column in cPanel Resource Usage before you spend anything, and ask your host directly what your EP limit is on your current plan and on the one they are recommending.
Why does my site show 508 errors when my CPU usage is only 15%?
Two reasons, and both are common. First, the figure you are reading is an average over hours, while a fault lasts seconds, so a serious spike barely moves the average. Second, and more likely, CPU is not the limit you hit. The usual culprit is Entry Processes, which caps how many requests run simultaneously rather than how much processing they use. Twenty visitors loading pages that each take two seconds will exhaust a concurrency limit of twenty while barely touching the processor. Look at the Faults column per limit type rather than at any usage percentage.
Can bots and crawlers cause resource limit errors?
Yes, and on small sites this is now one of the leading causes. AI training crawlers and scrapers often request pages in parallel with no rate limiting, and several ignore robots.txt, so the Crawl-delay directive most articles recommend does nothing. Check the busiest user agents in your access log. If crawlers dominate, filter them before they reach PHP using Cloudflare firewall rules or bot fight mode, because blocking at the edge is the only approach that protects your Entry Process limit. Verify any bot claiming to be Googlebot with a reverse DNS lookup before blocking it.
What is the difference between a 508 and a 503 error?
A 503 means the server as a whole is refusing requests right now, whether for maintenance, an exhausted PHP-FPM queue, or overall machine load. A 508 means the server is healthy and specifically your hosting account exceeded its own allowance, so every other site on that machine is unaffected. The practical difference is who can fix it: a 503 often needs your host, while a 508 is nearly always yours to solve. Confusingly, some LiteSpeed based hosts return a 503 for the same underlying condition, so if your 503s track your traffic peaks, treat them as resource limits and follow this guide instead of our 503 guide.
Do 508 errors hurt my SEO?
They can, in a way that compounds. Googlebot crawls in parallel, so it is unusually good at triggering concurrency limits, and when it receives repeated 5xx responses it reduces your crawl rate to avoid making things worse. Sustained errors can eventually lead to pages being dropped from the index. A 503 with a Retry-After header is the polite signal Google understands as temporary, and a 508 carries no such meaning, so it simply reads as a broken server. Check Search Console under Crawl Stats for a rise in server errors that lines up with your fault timestamps.
Will uptime monitoring catch a 508 resource limit error?
Yes. A 508 is a real HTTP status code rather than a 200 page containing an apology, so any monitor validating status codes flags it on the next check. Two details matter for this specific error. Use the shortest interval you can, because a fault window can be shorter than a five minute gap between checks. And monitor uncacheable paths such as cart, checkout, and login rather than only the homepage, since a cached homepage keeps returning 200 throughout. Notifier alerts by email, SMS, phone call, or Slack, checks every minute on paid plans starting at $4/month, and tracks the response time trend that warns you weeks before the first fault.