At a Glance
- •Cloudflare error 524 means the connection to your origin server worked and the request was delivered, but your server did not send back a response within about 100 seconds, so Cloudflare gave up and served the error page. Your server is usually still running that request.
- •The 100 second limit is fixed on the Free, Pro, and Business plans. Only Enterprise can raise it, up to 6000 seconds, so for everyone else the fix is making the response faster or taking the request off the proxied path.
- •Raising PHP max_execution_time, Nginx proxy_read_timeout, or Apache Timeout on your own server does not fix a 524. Those settings control how long your stack waits, not how long Cloudflare waits.
- •The usual causes in order are a slow database query, an outbound API call with no timeout set, and work that belongs in a background job such as report exports, bulk imports, and PDF generation. A 524 on one page while the rest of the site loads is the signature of all three.
- •Cloudflare returns a real HTTP 524 status code, so an uptime monitor catches it on the next check, and response time tracking warns you weeks earlier. Notifier is free for 10 monitors with SSL and DNS monitoring included, and paid plans start at $4/month.
A page spins for a minute and a half, then Cloudflare's grey error screen appears: Error 524: A timeout occurred. Cloudflare is marked as working, your host is marked with an error, and the rest of your site loads perfectly.
That combination is the whole story. Cloudflare reached your server, delivered the request, and then waited about a hundred seconds for a response that never arrived. Your server is not down. It is almost certainly still working on that request right now, long after the visitor gave up and Cloudflare closed the connection.
This guide covers what actually fixes a 524, in the order the causes show up in practice. It also covers the single most common wasted afternoon: raising timeout settings on your own server, which feels like the obvious fix and does nothing at all. If you do not run the site, skip to the visitor section, which is short.
What Cloudflare Error 524 Actually Means
When your domain is proxied through Cloudflare (the orange cloud in your DNS settings), visitors never talk to your server. They talk to the nearest Cloudflare data center, and Cloudflare opens its own connection to your origin to fetch the page.
For a 524, three things went right before anything went wrong:
- The TCP connection succeeded. Your server accepted the connection, so it is running, reachable, and not firewalled. That alone rules out most of the causes behind a 522 error.
- The TLS handshake succeeded. Your certificate was accepted, so this is not a certificate problem.
- The HTTP request was delivered. Your application received it and started work. You will find the request in your access log, often with a completion time well past the point where Cloudflare stopped listening.
Then Cloudflare waited. On the Free, Pro, and Business plans the proxy read timeout is fixed at 100 seconds. When that expires with no response, Cloudflare closes the connection and serves the 524 page with a genuine HTTP 524 status code, which is why uptime monitors and log parsers can detect it without reading the page text.
The detail that changes how you debug this:
Your server does not know the visitor left. In most stacks the PHP script, the Python view, or the database query keeps running to completion, consuming a worker and a database connection the entire time. If visitors reload an endpoint that takes three minutes, each reload starts a fresh copy of the same slow work while the abandoned ones are still running. A single slow report page can saturate a healthy server in a few minutes this way, at which point the rest of the site starts failing too.
So a 524 is a performance problem wearing an outage costume. Nothing is broken in the way a 500 or a 502 is broken. Something is simply too slow, and 100 seconds is the line Cloudflare draws.
524 vs 522 vs 504: Which One Do You Actually Have
These three get confused constantly because all of them mean "a proxy could not get your page." They fail at completely different stages, and the stage tells you where to look.
| Error | What Failed | Timing Tell | Start By Checking |
|---|---|---|---|
| 520 | Origin returned something Cloudflare could not parse | Varies | Oversized headers, empty responses, crashed workers |
| 521 | Origin refused the connection | Instant | Web server stopped, wrong port, firewall rejecting |
| 522 | Connection never opened, no answer at all | About 15 seconds | Firewall dropping Cloudflare IPs, server out of capacity |
| 524 | Connection fine, request delivered, response never finished | About 100 seconds | Slow queries, slow outbound API calls, long running jobs |
| 525 | TLS handshake with the origin failed | Fast | Origin certificate, cipher and TLS version mismatch |
| 526 | Origin certificate invalid in Full (strict) mode | Fast | Expired or self signed origin certificate |
| 504 | A proxy you control timed out waiting on your app | Your own timeout value | Nginx or Apache in front of PHP-FPM, Gunicorn, Node |
The 504 row is worth reading twice. A 504 gateway timeout has the same underlying cause as a 524, a response that took too long, but the proxy that gave up is yours rather than Cloudflare's. If your own stack times out first you get a 504 and a line in your error log naming the upstream. If Cloudflare times out first you get a 524 and nothing in your error log at all, because from your server's point of view the request is still going fine. That asymmetry is why 524s feel so much harder to debug than 504s, and it is also the basis for a genuinely useful trick covered in the timeouts section below.
One more distinguishing signal: 522s take the whole site down, because a firewall block or a saturated connection queue affects every request equally. A 524 usually hits specific pages. If your homepage loads instantly and only /wp-admin/, a report export, or one API route fails, you have a 524 pattern regardless of what the page says.
If You Are a Visitor, Not the Site Owner
There is no client side fix for a 524. The failure happened between two servers, neither of which is yours. Clearing your cache, flushing DNS, changing your resolver, or restarting your router will not help, because none of your local state was involved.
What is worth doing:
- Wait a couple of minutes, then reload once. Many 524s are caused by a temporary load spike that clears on its own.
- Do not hold down refresh. Every reload starts another copy of the slow request on a server that is already struggling. You are making it worse for yourself and everyone else.
- Try a different page on the same site. If the homepage loads, the site is up and one specific feature is slow. That is useful information for the owner.
- Note the Ray ID. The string at the bottom of the Cloudflare error page identifies your exact request. If you report the problem, include it.
- Check whether it is just you. Our guide on whether a site is down for everyone or just you covers the quickest ways to confirm.
Find the Slow Request in Three Steps
1. Confirm the status code and the timing
Run this against the failing URL and let it sit:
curl -o /dev/null -s -w "status: %{http_code} total: %{time_total}s\n" https://example.com/reports/export
A result near status: 524 total: 100.2s confirms it. If it comes back at roughly 15 seconds you are looking at a 522, so read the 522 guide instead. If it comes back instantly with a 521, your web server is not accepting connections.
2. Time the same request against your origin directly
This is the step that turns guessing into knowing. Bypass Cloudflare entirely by pointing curl at your origin IP while still sending the correct hostname:
# Replace 203.0.113.10 with your real origin IP
curl -o /dev/null -s -w "status: %{http_code}  total: %{time_total}s\n" \
  --resolve example.com:443:203.0.113.10 \
  --max-time 300 \
  https://example.com/reports/export
Note the --max-time 300, which gives the request five minutes instead of curl's default patience. Read the result like this:
- It returns 200 after 140 seconds. You have your answer. The endpoint works, it is just slower than Cloudflare's limit. Everything below applies to you.
- It returns 200 in under a second. The slowness is conditional. It only happens for logged in users, for one account with a lot of data, under concurrent load, or when an external service is having a bad day. Reproduce it with a real session cookie or under load.
- It returns 502 or 504 from your own server. Your stack is timing out before Cloudflare does. That is actually the better failure mode, and it is covered in the 502 and 504 guides.
3. Get request times into your access log
Most default access log formats do not record how long a request took, which makes slow endpoints invisible. Fix that first. In Nginx, add a log format that includes $request_time and $upstream_response_time:
log_format timed '$remote_addr - $remote_user [$time_local] "$request" '
                 '$status $body_bytes_sent "$http_referer" '
                 'rt=$request_time urt=$upstream_response_time';

access_log /var/log/nginx/access.log timed;
In Apache, add %D (microseconds) to your LogFormat:
LogFormat "%h %l %u %t \"%r\" %>s %b %D" timed
CustomLog ${APACHE_LOG_DIR}/access.log timed
Reload, wait for the error to recur, then pull the worst offenders out of the log:
# The 20 slowest request times in the log
grep -o 'rt=[0-9.]*' /var/log/nginx/access.log | sort -t= -k2 -rn | head -20

# Every request that ran longer than Cloudflare will wait
awk '{for(i=1;i<=NF;i++) if($i ~ /^rt=/) {split($i,a,"="); if(a[2]>100) print}}' /var/log/nginx/access.log
Requests appearing in that second list with a 200 status are the exact ones your visitors saw as 524s. Your server finished the work and had nobody left to hand it to.
Cause 1: Application Code That Takes Too Long
This is the most common category, and within it one cause dominates so heavily it deserves to go first.
Outbound API calls with no timeout
Your page calls a payment provider, a shipping rate service, a CRM, an analytics endpoint, or an AI API. If that call has no timeout set, your request inherits the remote service's patience. When their API hangs, your page hangs, and 100 seconds later Cloudflare serves a 524 for a problem that lives in somebody else's data center.
Most HTTP clients default to no timeout at all. Set one explicitly everywhere:
# Python requests: (connect timeout, read timeout). Without this it waits forever.
resp = requests.get(url, timeout=(3, 10))

# PHP with Guzzle
$client->request('GET', $url, ['connect_timeout' => 3, 'timeout' => 10]);

# WordPress: the default is 5 seconds, but plugins often override it
$resp = wp_remote_get($url, ['timeout' => 5]);

# Node with fetch
const controller = new AbortController();
setTimeout(() => controller.abort(), 10000);
await fetch(url, { signal: controller.signal });
Then decide what your page does when the call fails. Degrading gracefully, hiding a widget, showing cached data, or rendering the page without the optional section, is almost always better than an error page. Also add a monitor for the third party API itself so you can tell within a minute whether a slowdown is yours or theirs. Our guide on monitoring an API endpoint covers how to do that with authentication headers.
Work that should not happen during a web request
The classic 524 endpoints are all variations on the same mistake, doing batch work inside a request that a human is waiting on:
- Report generation and CSV or Excel exports across a large date range
- PDF and invoice generation, especially with a headless browser involved
- Bulk imports triggered by a file upload
- Image or video processing on upload
- Sending newsletters or bulk email in a loop
- Data migrations and cache rebuilds run through an admin page
- Anything looping over "every customer" or "every order"
The fix is the same in every framework. Accept the request, queue the work, return immediately, and let the browser poll or receive an email when the job finishes:
# Before: the browser waits four minutes and gets a 524 at 100 seconds
@app.route('/reports/export')
def export():
    data = build_giant_report()      # 4 minutes of work
    return send_file(data)

# After: the request returns in milliseconds
@app.route('/reports/export', methods=['POST'])
def export():
    job = queue.enqueue(build_giant_report, current_user.id)
    return jsonify({'job_id': job.id, 'status': 'queued'}), 202

@app.route('/reports/export/<job_id>')
def export_status(job_id):
    job = queue.fetch_job(job_id)
    return jsonify({'status': job.get_status(), 'url': job.result})
Use whatever your stack already has: Celery or RQ for Python, Sidekiq or Active Job for Rails, Laravel queues for PHP, BullMQ for Node, and Action Scheduler or wp_schedule_single_event() for WordPress. This is more work than changing a config value, and it is the only fix that survives your dataset doubling.
WordPress and WooCommerce specifics
WordPress produces 524s through a few recognizable routes. wp-cron.php fires on page loads, so on a busy site an unlucky visitor pays for every scheduled task at once. Plugin and theme update checks call remote servers synchronously during admin page loads. WooCommerce analytics and report queries scan huge order tables. A stuck Action Scheduler queue retries the same failing job endlessly.
The single highest value change is moving cron off page loads and onto the system scheduler:
# In wp-config.php, stop cron running on visitor page loads
define('DISABLE_WP_CRON', true);

# Then in your server crontab, run it on a schedule instead
*/5 * * * * cd /var/www/example.com && wp cron event run --due-now >/dev/null 2>&1
Our WordPress uptime monitoring guide and WooCommerce monitoring guide cover which WordPress URLs are worth monitoring separately, since a slow checkout is invisible if you only watch the homepage.
Cause 2: Slow Database Queries
If the application code looks reasonable, the time is almost always going into the database. Two symptoms point here specifically: the endpoint used to be fast and got slower as data accumulated, or it is fast for small accounts and slow for your biggest customer.
See what is running right now
Trigger the failing page, then immediately look at active queries. For PostgreSQL:
SELECT pid,
       now() - query_start AS duration,
       state,
       left(query, 120) AS query
FROM pg_stat_activity
WHERE state <> 'idle'
  AND now() - query_start > interval '10 seconds'
ORDER BY duration DESC;
For MySQL or MariaDB:
SHOW FULL PROCESSLIST;

-- Or just the long ones
SELECT id, time, state, LEFT(info, 120)
FROM information_schema.processlist
WHERE command <> 'Sleep' AND time > 10
ORDER BY time DESC;
A query sitting there for 90 seconds is your 524. Run EXPLAIN on it and look for a full table scan where an index should be. Adding one index to a column used in a WHERE or JOIN clause routinely takes a query from two minutes to two milliseconds.
Turn on the slow query log
If the problem is intermittent, log it rather than trying to catch it live. For MySQL:
slow_query_log = 1
slow_query_log_file = /var/log/mysql/slow.log
long_query_time = 5
log_queries_not_using_indexes = 1
For PostgreSQL, set log_min_duration_statement = 5000 in postgresql.conf to log anything over five seconds.
Set a hard ceiling as a guardrail
Independently of fixing the slow query, cap how long any query is allowed to run. A query that fails at 30 seconds gives you an error in your logs with a stack trace. A query that runs for 100 seconds gives you a Cloudflare error page and no information at all.
-- PostgreSQL, per session or per role
SET statement_timeout = '30s';

-- MySQL 5.7 and later, milliseconds, SELECT statements
SET SESSION max_execution_time = 30000;
Also check connection pool size while you are here. When every pooled connection is held by a slow query, new requests queue for a connection that never frees up, and endpoints with no slow query of their own start timing out as well. That is how one bad report page turns into a site wide 524.
Cause 3: Requests That Genuinely Need More Than 100 Seconds
Sometimes the work really does take that long and there is no query to optimize. A restore job, a large data export, a video transcode, a webhook that processes a big payload. Here are the options, best first.
Option 1: Queue it and poll (recommended)
The pattern from the previous section. The request returns a job ID in under a second, the browser polls for status, and the user gets a download link or an email when it is done. This is the only option that also survives the visitor closing their laptop, a mobile connection dropping, and your dataset growing. Every other option on this list is a workaround.
Option 2: Keep bytes flowing
The proxy timeout applies to waiting with nothing arriving. If your endpoint streams output as it works, sending headers early and flushing partial content periodically, the connection stays active rather than sitting idle. This suits progress output, log tailing, and large file streaming, where you can send the first chunk immediately and keep going. It does not help when a single database query blocks for two minutes before anything can be produced.
Option 3: Take the endpoint off the proxied path
Create a subdomain such as jobs.example.com, set its DNS record to DNS only (the grey cloud) rather than proxied, and point the long running endpoint there. Cloudflare is no longer in the path, so its timeout does not apply.
Trade-off worth stating plainly: an unproxied record publishes your origin IP address in public DNS, permanently, and it stays in passive DNS history even after you change it back. That hostname also loses Cloudflare's DDoS protection and WAF. If you do this, restrict the endpoint by authentication or by IP allowlist at the firewall, and never point the grey cloud record at the same hostname that serves your main site.
Option 4: Raise the timeout (Enterprise only)
Cloudflare Enterprise plans can raise the proxy read timeout above 100 seconds, up to 6000 seconds, either through a Cache Rule with the Proxy Read Timeout setting or through the zone settings API:
curl -X PATCH "https://api.cloudflare.com/client/v4/zones/{zone_id}/settings/proxy_read_timeout" \
  -H "Authorization: Bearer $CF_API_TOKEN" \
  -H "Content-Type: application/json" \
  --data '{"value": 300}'
On Free, Pro, and Business plans this setting is not available and the 100 second limit is fixed. Raising it is also treating the symptom. A request that needs 300 seconds is a request nobody is waiting around for anyway.
Which Timeout Is Which (And Why Yours Does Not Help)
Search for this error and you will find advice to raise max_execution_time, proxy_read_timeout, or Apache's Timeout directive. It does not work, and understanding why makes the whole error make sense.
Every timeout in your stack controls how long your components wait for each other. Cloudflare's 100 seconds controls how long Cloudflare waits for you. Raising your own limits just means your server is more patient while Cloudflare hangs up on schedule.
| Setting | Who Is Waiting | Typical Default | Fixes a 524? |
|---|---|---|---|
| Cloudflare proxy read timeout | Cloudflare waiting for your origin | 100 seconds, fixed below Enterprise | This is the one |
| PHP max_execution_time | PHP waiting for its own script | 30 seconds | No |
| PHP-FPM request_terminate_timeout | FPM killing a stuck worker | Off | No |
| Nginx fastcgi_read_timeout | Nginx waiting for PHP-FPM | 60 seconds | No |
| Nginx proxy_read_timeout | Nginx waiting for an upstream app | 60 seconds | No |
| Apache Timeout / ProxyTimeout | Apache waiting for a backend | 60 seconds | No |
| Gunicorn or Puma worker timeout | App server killing a stuck worker | 30 to 60 seconds | No |
Use your own timeouts in the opposite direction:
Deliberately set your stack's timeouts below 100 seconds, somewhere around 30 to 60. You will never see a 524 again, because your own server always gives up first. What you get instead is a 502 or 504 that arrives in 30 seconds rather than 100, appears in your error log with the failing upstream named, and frees the worker instead of leaving it stuck. Faster failure, better diagnostics, and less load during the incident. The user still sees an error page, but you now know which request caused it.
WebSockets, Server Sent Events, and Long Polling
If your 524s show up in a chat feature, a live dashboard, a collaborative editor, or a notification stream, and they appear on a suspiciously regular schedule rather than under load, the cause is different: an idle connection being closed.
A WebSocket that sits open with no traffic for long enough gets closed by the proxy in between. The user sees a connection drop rather than an error page, but your logs fill with 524s and disconnect events. The fix is to make sure the connection is never idle for that long, by sending an application level heartbeat:
// Client side: ping every 30 seconds so the connection is never idle
const socket = new WebSocket('wss://example.com/live');

setInterval(() => {
  if (socket.readyState === WebSocket.OPEN) {
    socket.send(JSON.stringify({ type: 'ping' }));
  }
}, 30000);

// And reconnect rather than assuming the socket stays up forever
socket.onclose = () => setTimeout(connect, 1000);
For Server Sent Events, send a comment line periodically. It is ignored by the client but keeps data flowing:
# Every 20 seconds, emit a comment heartbeat
yield ": heartbeat\n\n"
For long polling, keep the server side hold below 100 seconds. A 30 to 45 second poll window with an immediate reconnect is the standard approach and stays well clear of the limit.
How to See It Coming Next Time
A 524 is the only Cloudflare error that reliably announces itself weeks in advance, because it is a performance problem. Nothing crosses the 100 second line without first crossing 10, then 30, then 60. If you are tracking response times you get a slow slide you can act on. If you are only checking whether the homepage returns 200, you find out when a customer emails you.
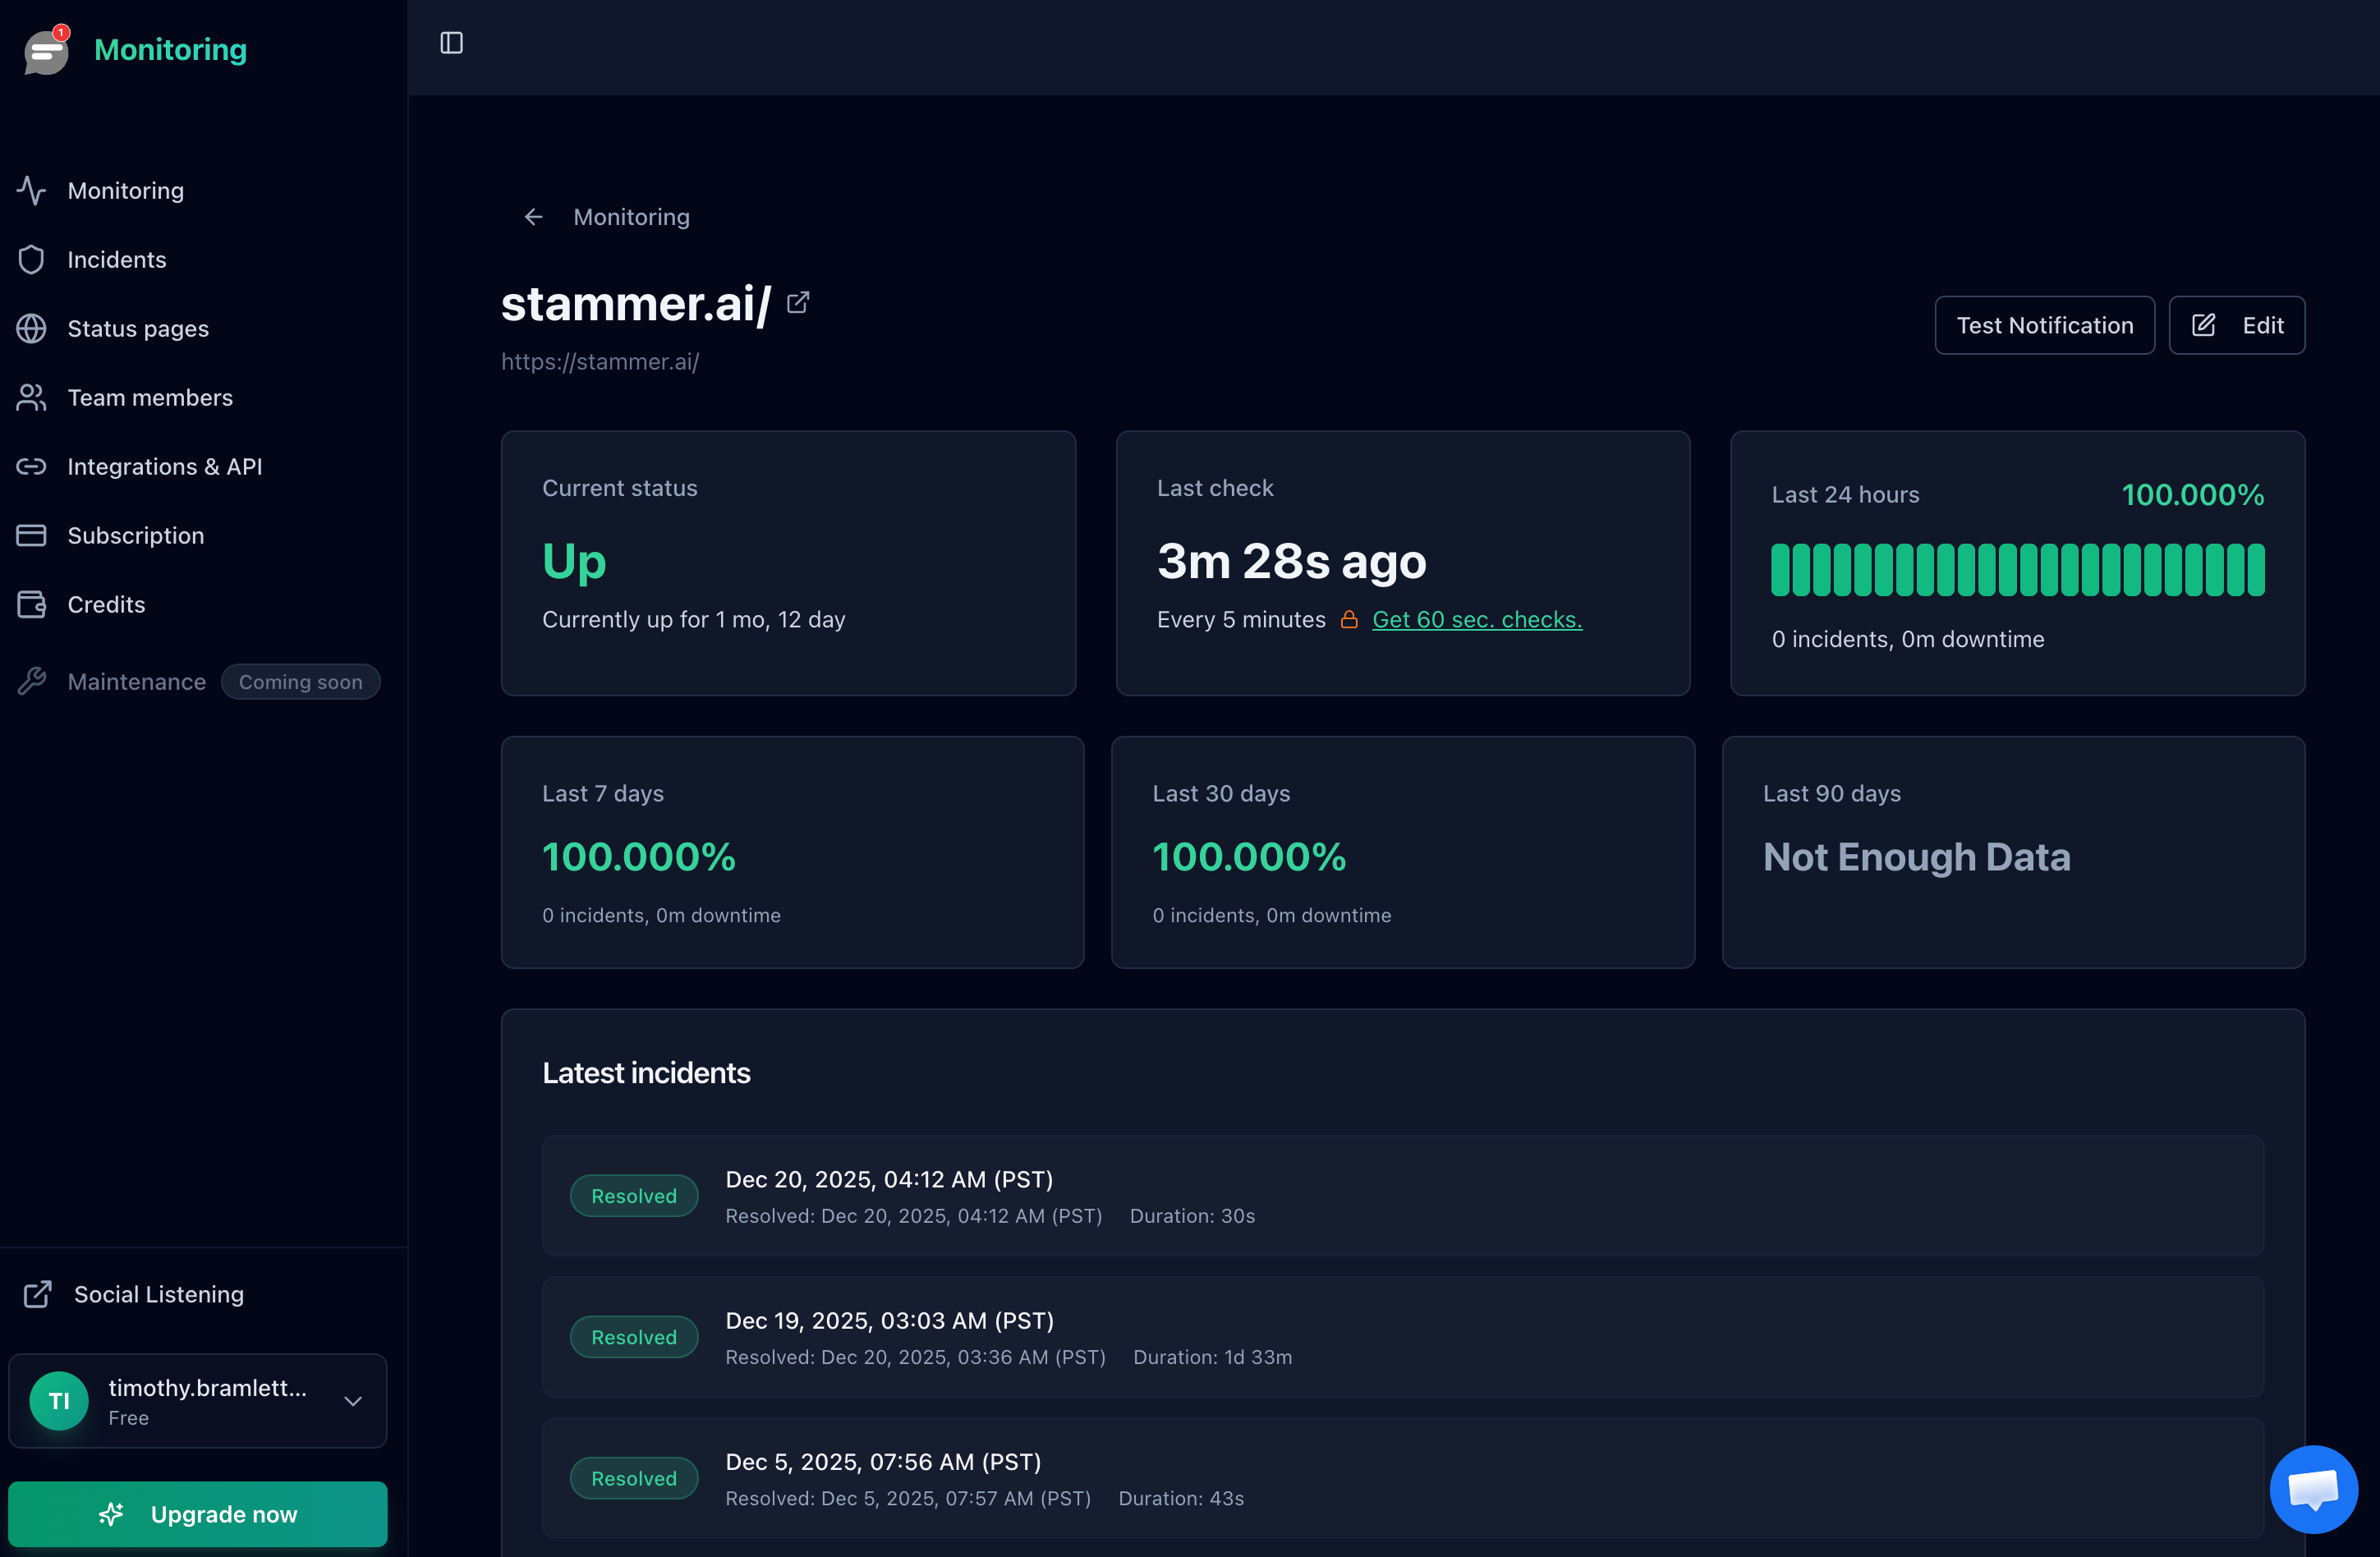
A response time line drifting upward week over week is a future 524. Our response time monitoring guide covers which thresholds to alert on.
Monitor the slow paths, not just the homepage
This matters more for a 524 than for any other error, because 524s are endpoint specific by nature. Your homepage is probably cached at the Cloudflare edge and will keep returning 200 while your checkout, admin, or reporting pages time out. A homepage only monitor will tell you everything is perfect throughout the entire incident.
- Add a monitor per critical path. Checkout, login, search, and the heaviest API route your product depends on. The website monitoring checklist lists what else belongs on that list.
- Add a second monitor on an unproxied origin hostname. When both alert, the origin is at fault. When only the proxied one alerts, the problem is on the Cloudflare leg. The alert itself tells you where to look before you open a terminal.
- Watch response time, not only availability. Alerting on a page that has gone from 400ms to 8 seconds buys you weeks.
- Keep SSL and DNS covered too. The 525 and 526 rows in the table above are certificate failures, and expiry is the most preventable outage there is. Notifier includes SSL certificate monitoring on every plan, free tier included.
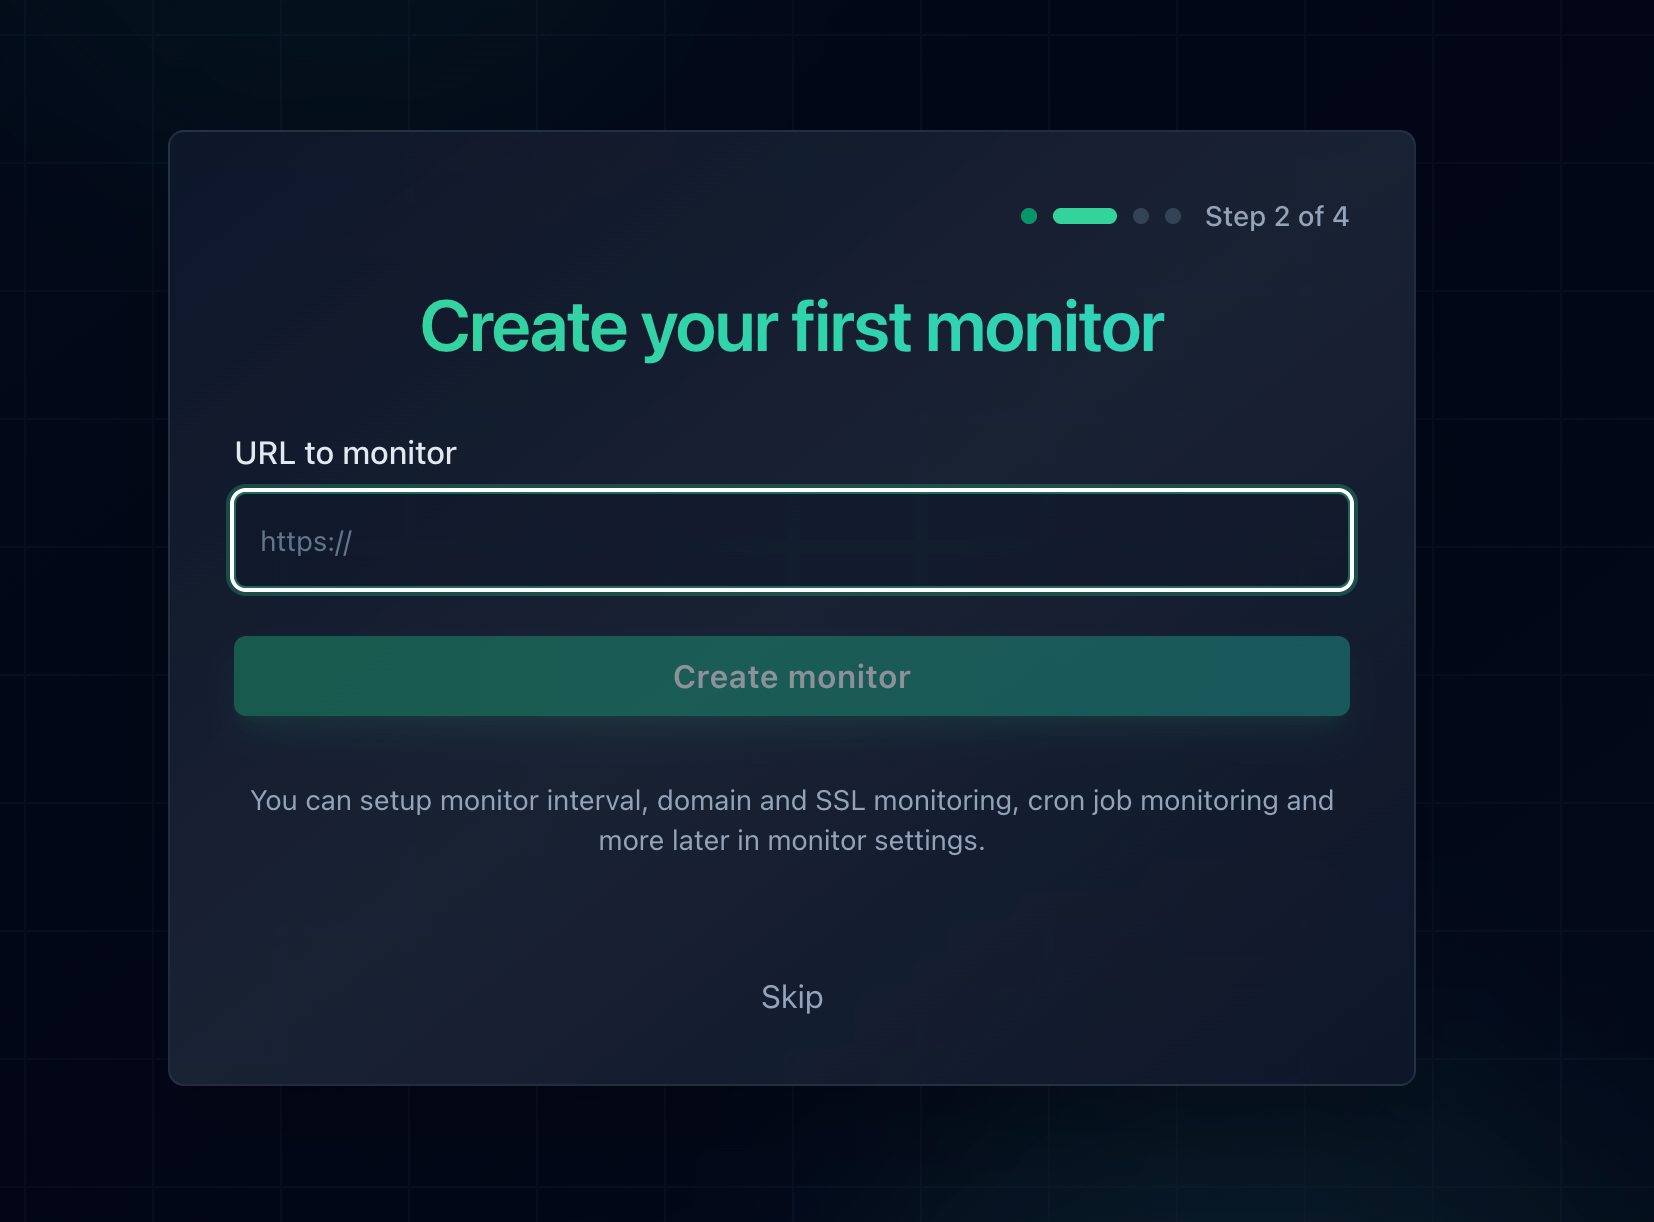
Adding one monitor per critical URL takes about thirty seconds each.
Make sure the alert reaches you
Because Cloudflare returns a genuine HTTP 524 status code rather than a 200 containing an error page, any monitor that validates status codes flags it on the next check. What matters then is the channel. An email at 3 AM is worth nothing. Notifier sends email, SMS, phone call, and Slack alerts on every plan including the free tier, so a checkout page crossing the timeout can ring your phone rather than wait in an inbox.
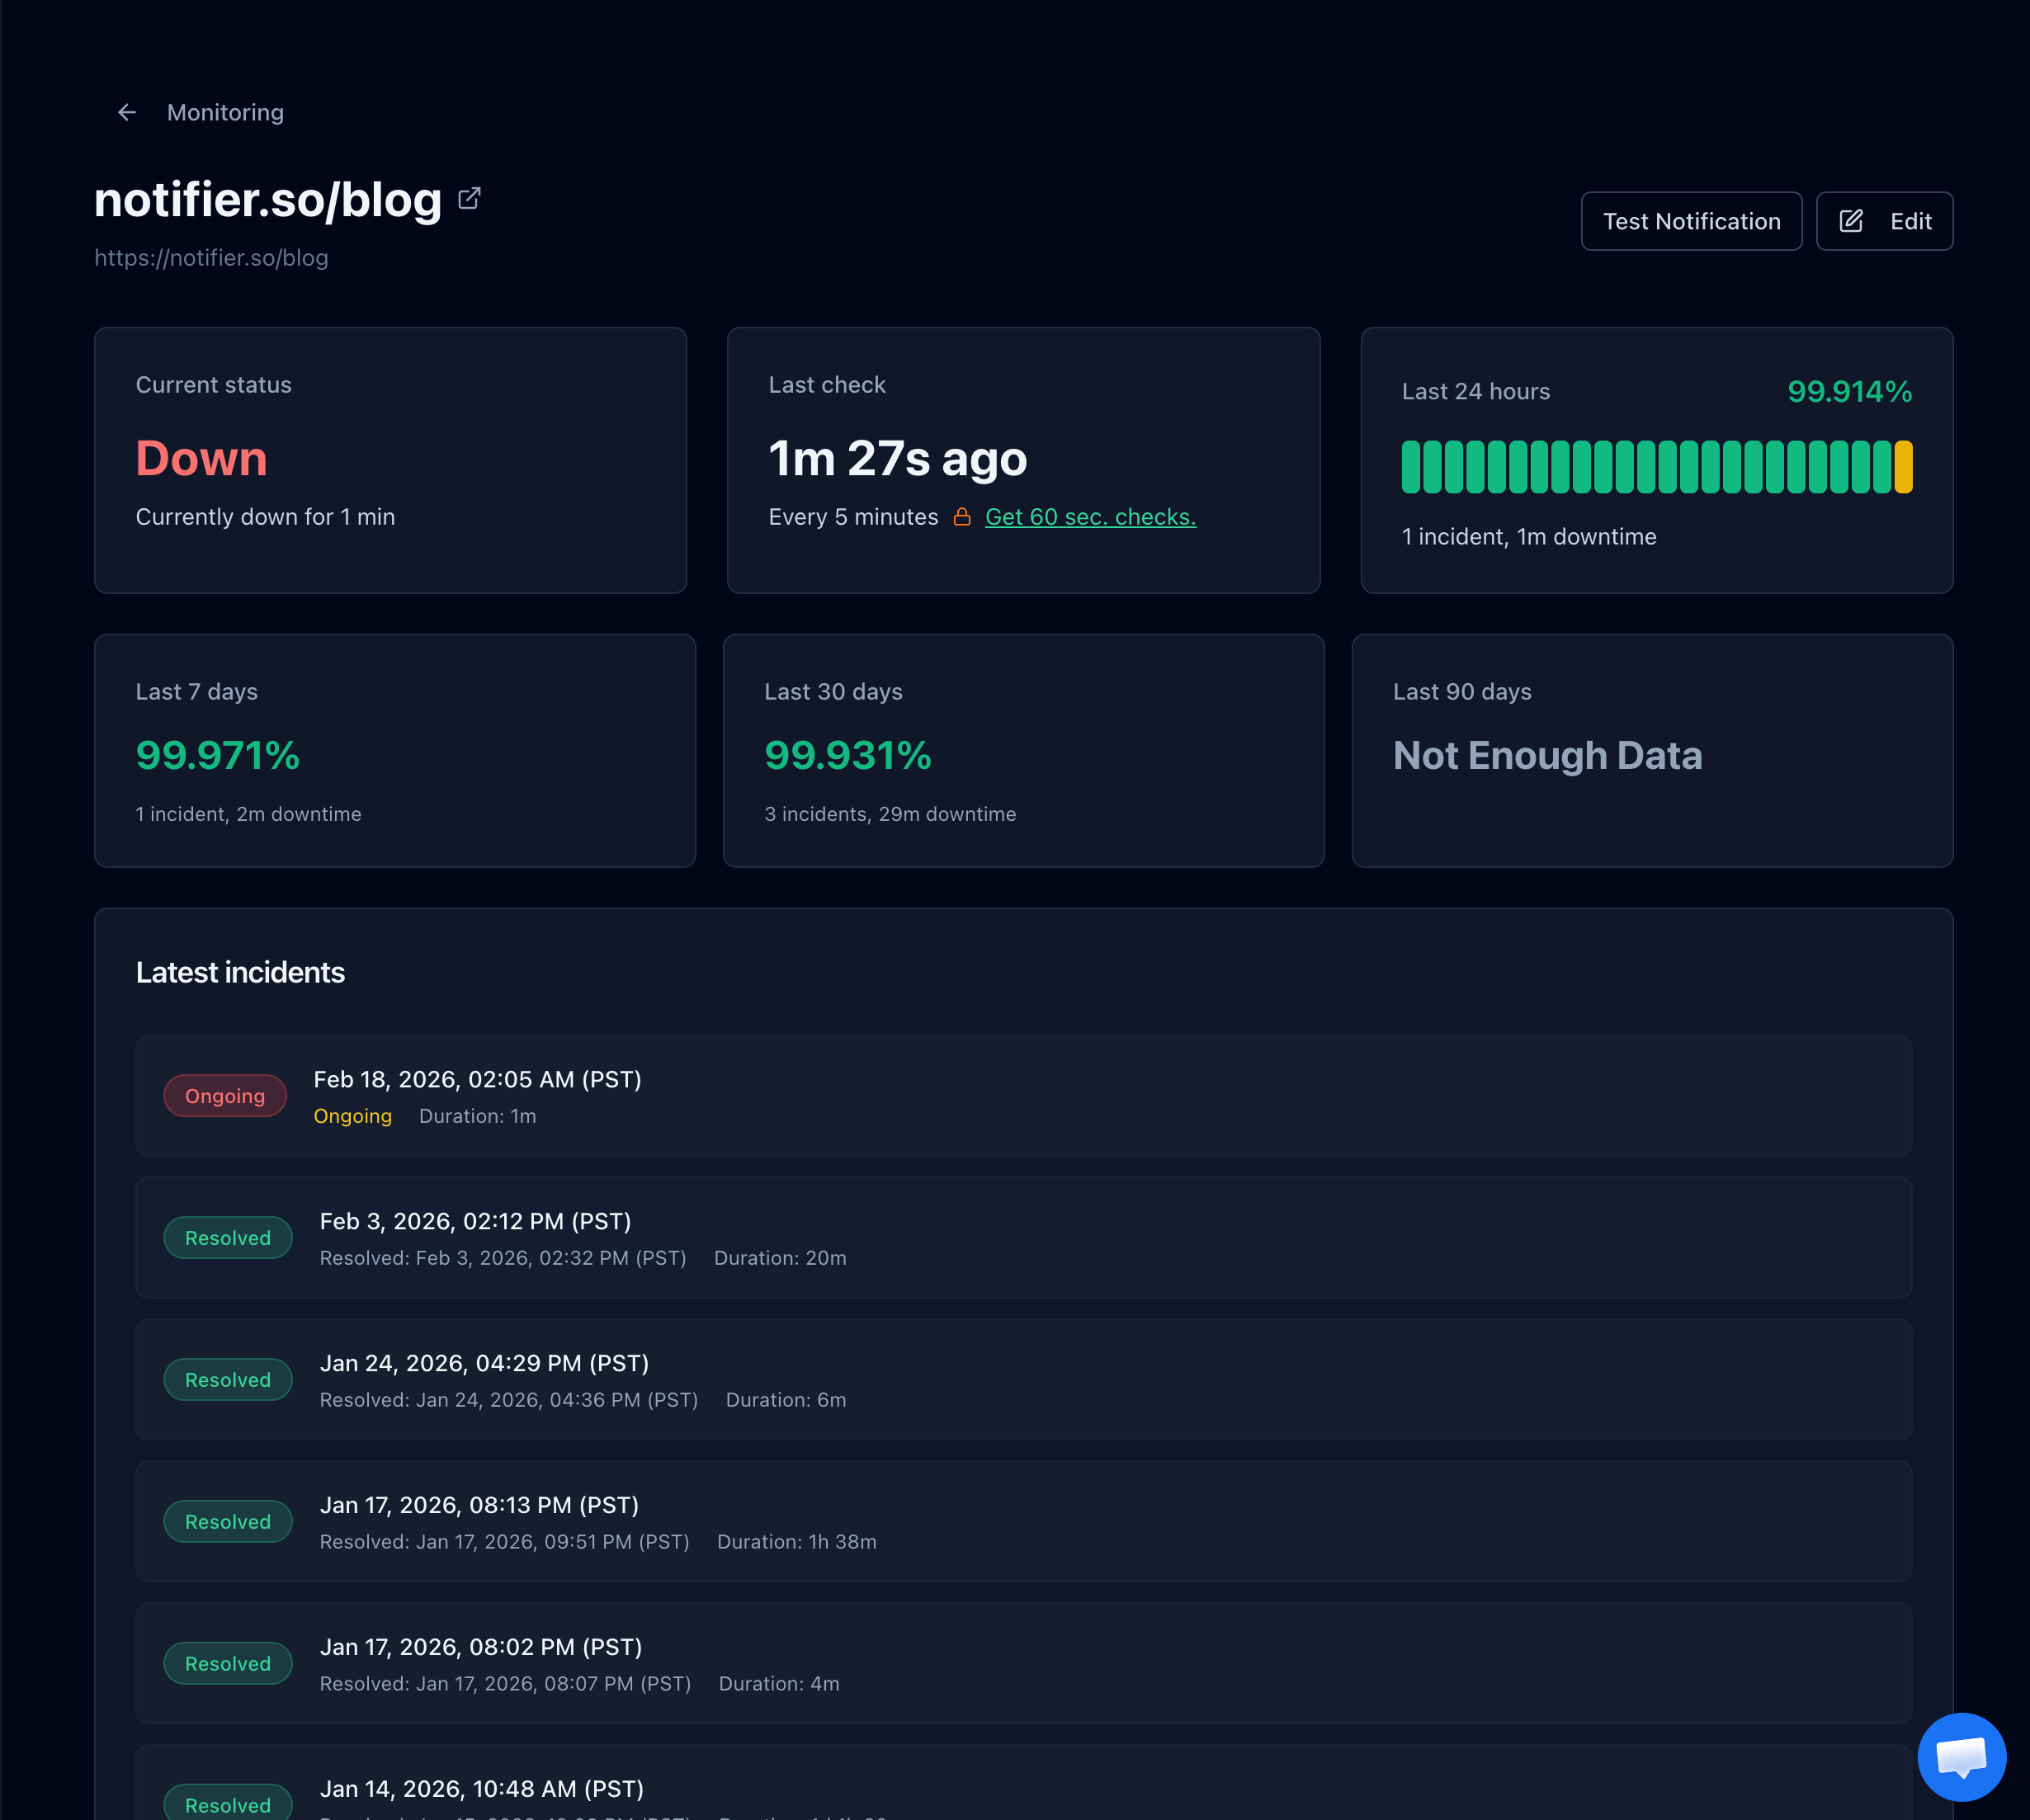
A non-2xx response, including Cloudflare's 524, flips the monitor to down and starts an incident record.
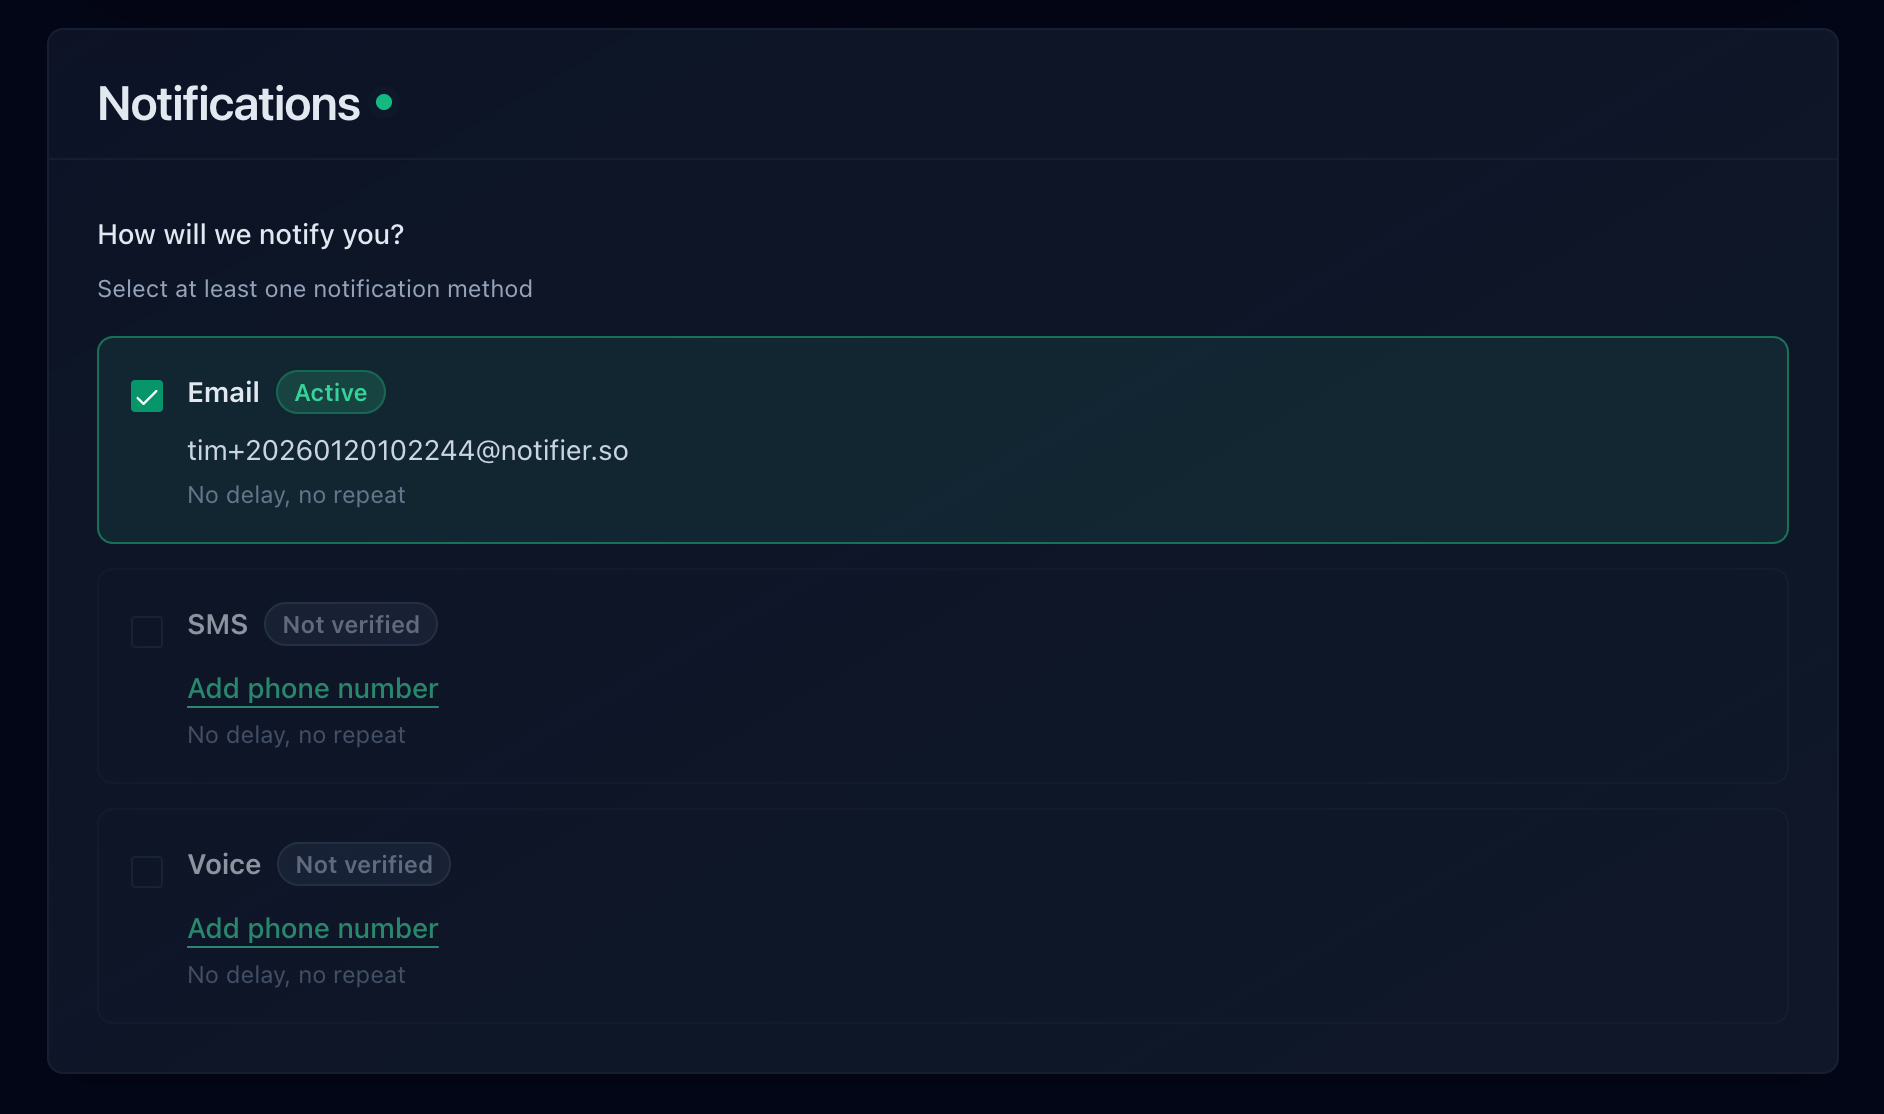
Email, SMS, phone call, and Slack are all available, including on the free plan.
How the Common Tools Compare
Check interval sets your worst case detection delay, and monitor count decides whether you can afford to watch every critical path rather than just the homepage. Here is how the popular options compare on their free plans:
| Tool | Free Plan | Alert Channels on Free | Notes |
|---|---|---|---|
| Notifier | 10 monitors, 5 min checks, 5 status pages | Email, SMS, phone, Slack | SSL and DNS monitoring included on every plan. Response time tracked on all monitors. Free tier is fine for commercial use. Solo is $4/month for 20 monitors at 1 minute. |
| UptimeRobot | 50 monitors, 5 min checks, 1 status page | Free plan is non-commercial only. SMS and voice run on one-time credit bundles. Paid plans start at $8/month for 10 monitors. | |
| Better Stack | 10 monitors, 3 min checks, 1 status page | Email, Slack | Capable incident management, but pricing is per responder at $34/month and climbs quickly for a team. |
| StatusCake | 10 monitors, 5 min checks | Only 1 SSL monitor on free. The first paid tier is $24.49/month. | |
| Uptime Kuma | Unlimited, self-hosted | Many, via integrations | Free and flexible, but you host it, and it cannot alert you if it is running on the server that got slow. |
Important: UptimeRobot restricted its free plan to non-commercial use only in October 2024. If the site behind Cloudflare belongs to a business or a client, that free tier is not an option. Notifier's free tier has no such restriction.
Pricing changes, so verify before you commit. Our comparison of free website monitoring tools goes through each free tier in detail, and how to set up website monitoring walks through the whole setup end to end.
Frequently Asked Questions
What is the difference between Cloudflare error 524 and 522?
They fail at different stages. A 522 means Cloudflare could not open a connection to your server at all, so nothing was ever delivered, and the error appears after about 15 seconds. A 524 means the connection opened, the request was delivered, your application started working on it, and no response came back within about 100 seconds. A 522 points at firewalls and server capacity. A 524 points at slow code and slow queries. The time the error page takes to appear tells you which one you have.
Can I increase Cloudflare's 100 second timeout?
Only on the Enterprise plan, where the proxy read timeout can be raised as high as 6000 seconds through a Cache Rule or the zone settings API. On Free, Pro, and Business the 100 second limit is fixed and there is no setting to change. For those plans the real options are making the response faster, moving the work into a background job, or moving that one endpoint to a DNS only subdomain so Cloudflare is not in the path.
Does raising PHP max_execution_time fix a 524 error?
No, and this is the most common wasted fix. Settings like max_execution_time, Nginx proxy_read_timeout, and Apache Timeout control how long your own components wait for each other. Cloudflare's 100 seconds controls how long Cloudflare waits for you, and nothing on your server changes it. Raising your limits only makes your server more patient while Cloudflare hangs up on the same schedule. Setting your own timeouts lower than 100 seconds is more useful, because then you get a fast 502 or 504 in your error log instead of a slow 524 you cannot see.
Can I fix a 524 error as a visitor?
No. The failure happened between Cloudflare and the site's server, and none of your local settings were involved, so clearing your cache or flushing DNS will not help. Wait a couple of minutes and reload once, since many 524s are caused by temporary load. Avoid holding down refresh, because each reload starts another copy of the slow request on a server that is already struggling. If you need to report it, include the Ray ID from the bottom of the error page.
Why does only one page return a 524 while the rest of the site works?
That is the normal pattern, and it is the clearest sign you have a 524 rather than a 522. The server is healthy and fast for most requests, and one specific endpoint does something expensive: a report query across a large table, an outbound API call with no timeout, a bulk export, or a page that loops over every record. Everything else is served quickly, or served straight from the Cloudflare cache, so the site looks fine right up until someone opens that page.
Do WebSockets cause Cloudflare 524 errors?
They can, through inactivity rather than slowness. A WebSocket or Server Sent Events connection that sits open with no data moving across it long enough gets closed by the proxy in between. The signature is disconnects on a regular rhythm rather than under load. Send an application level heartbeat every 30 seconds from the client, emit a periodic comment line for Server Sent Events, keep long polling windows under about 45 seconds, and have the client reconnect automatically on close.
Will uptime monitoring catch a Cloudflare 524?
Yes. Cloudflare returns the error with a real HTTP 524 status code rather than a 200 containing an error page, so any monitor that validates status codes flags it on the next check. With Notifier you get an email, SMS, phone call, or Slack message within a minute on a paid plan or within five minutes on the free tier. The bigger win is response time tracking, which shows the endpoint sliding from 5 seconds to 40 to 90 over several weeks, giving you time to fix it before it ever crosses the line. Monitor the heavy pages individually, since a cached homepage will keep returning 200 throughout.