At a Glance
- •Cloudflare error 522 means Cloudflare tried to open a connection to your origin server and got no answer at all, so after roughly 15 seconds it gave up and served the error page instead. Cloudflare itself is working.
- •The three leading causes, in order: a firewall or security plugin dropping Cloudflare IP ranges, an origin server out of capacity to accept new connections, and a Cloudflare DNS record still pointing at an old server after a migration.
- •The fastest test is to hit the origin IP directly with curl and --resolve. If it loads for you but not for Cloudflare, allowlist the current Cloudflare IP ranges from cloudflare.com/ips, including the IPv6 ones.
- •Timing identifies the error: instant means 521 (refused), about 15 seconds means 522 (no answer), and over a minute means 524 (response never finished).
- •Cloudflare returns a real HTTP 522 status code, so any uptime monitor catches it on the next check. Notifier is free for 10 monitors with SSL and DNS monitoring included, and paid plans start at $4/month for 1-minute checks.
Your site loads a grey Cloudflare page instead of your homepage. It says Error 522: Connection timed out, with Cloudflare marked as working and your host marked with a red error. The page took roughly fifteen seconds to appear, which is the clue that matters.
A 522 means Cloudflare tried to open a connection to your server and never got an answer. Cloudflare is fine. DNS is fine. Something between Cloudflare's edge and your origin is swallowing the connection, and in the overwhelming majority of cases it is one of three things: a firewall dropping Cloudflare's IP addresses, an origin server that has run out of capacity to accept new connections, or a DNS record pointing at a server that is no longer there.
This guide walks through the fixes in the order they actually solve the problem. If you do not run the site, skip to the visitor section, which is short, because there is genuinely very little you can do from your side.
What Cloudflare Error 522 Actually Means
When your domain is proxied through Cloudflare (the orange cloud in your DNS settings), no visitor ever talks to your server directly. The request goes to the nearest Cloudflare data center, and Cloudflare opens its own connection to your origin server to fetch the page.
Error 522 is Cloudflare telling you that second connection never completed. It sent the opening TCP packet to your server and waited. Nothing came back. After roughly fifteen seconds it gave up and served the 522 page instead. Cloudflare returns it with an actual HTTP status code of 522, which is why monitoring tools and log parsers can spot it without reading the page text.
That silence is the whole diagnosis. There are only two ways a server stays silent when someone knocks:
- Something dropped the packet. A firewall rule, a cloud security group, or an intrusion prevention tool decided to discard traffic from Cloudflare's IP ranges rather than reject it. Dropping produces silence. Rejecting would have produced a 521 instead.
- The server was too busy to answer. The machine is up and the web server process is running, but the connection queue is full, memory is exhausted, or every worker is stuck on a slow query. New connections sit in the backlog until Cloudflare's patience runs out.
The distinction between a dropped packet and a refused one is the single most useful thing to understand here, and it is the same distinction that separates ERR_CONNECTION_TIMED_OUT from ERR_CONNECTION_REFUSED in a browser. A refusal is instant. A timeout takes fifteen seconds because nothing is on the other end to say no.
The timing tells you which error you have:
A Cloudflare error page that appears instantly is a 521 (connection refused) or a 523 (host unreachable). One that appears after about fifteen seconds is a 522. One that appears after a minute or more, on a page that started loading, is a 524. Notice how long you waited before you start changing config.
Cloudflare Errors 520 to 526 Compared
Cloudflare's 5xx errors all render the same grey page with slightly different wording, so they get confused constantly. Each one points at a different stage of the connection, and knowing which stage failed removes most of the guesswork.
| Error | Wording | What Failed | Usual Cause |
|---|---|---|---|
| 520 | Web server returned an unknown error | Origin answered with something invalid | Empty response, crashed worker, oversized headers |
| 521 | Web server is down | Origin actively refused the connection | Nginx or Apache stopped, port closed, firewall REJECT rule |
| 522 | Connection timed out | Origin never answered the connection attempt | Firewall dropping Cloudflare IPs, overloaded server, stale DNS record |
| 523 | Origin is unreachable | Cloudflare could not route to the address at all | Invalid or private IP in the DNS record, upstream routing problem |
| 524 | A timeout occurred | Connection opened, response never finished | Slow query or long running script exceeding 100 seconds |
| 525 | SSL handshake failed | TLS negotiation with the origin broke down | No certificate on the origin, cipher or protocol mismatch |
| 526 | Invalid SSL certificate | Origin certificate failed validation | Expired or self-signed certificate with Full (strict) mode enabled |
If you are actually looking at a 525 or 526, the fix is a certificate problem rather than a connection problem, and our guides on ERR_SSL_PROTOCOL_ERROR and NET::ERR_CERT_DATE_INVALID cover the same ground from the browser side. If you are seeing a 502 or 504 without Cloudflare branding, the proxy in question is your own, and the 502 bad gateway guide is the right place to start.
If You Are Just Trying to Visit the Site
Honest answer first: a 522 is a server side failure and you cannot fix it from your device. The Cloudflare edge nearest you is working, which is why you got a page at all. The site's own server is not answering. That said, three things are worth ruling out before you give up.
- Wait two minutes and reload. Many 522s are transient. A traffic spike, a deploy, or a database restart will produce them for a couple of minutes and then clear on their own. A hard reload with Ctrl and F5 (Cmd, Shift and R on Mac) avoids a cached error page.
- Check whether it is only you. Cloudflare has hundreds of data centers, and a routing problem can affect one region while the rest of the world loads the site fine. Test on mobile data, or use a checker. Our guide on whether a site is down for everyone or just you covers the tools worth using.
- Check the Cloudflare status page. Rarely, a specific Cloudflare data center has a problem reaching a region of the internet. status.cloudflarestatus.com lists incidents by location.
What will not help: flushing your DNS cache, changing your resolver, clearing cookies, restarting your router, or disabling your VPN. Those fix client side errors. A 522 was generated by Cloudflare's server after it failed to reach someone else's server, and none of your local state was involved. If the site matters to you, tell the owner, and include the Ray ID printed at the bottom of the error page. It lets them find the exact request in their Cloudflare logs.
Diagnose It in Five Minutes
Everything below assumes you run the site. Do these three checks in order before changing anything. They narrow the cause from "something is wrong" to one specific layer.
Step 1: Confirm It Is Really a 522
From your laptop, look at the headers rather than the page:
curl -sI https://example.com
You are looking for two lines. A status line of HTTP/2 522 and a server: cloudflare header confirm Cloudflare generated the response. Note the cf-ray value. Time the command as well:
curl -so /dev/null -w "status=%{http_code} time=%{time_total}s\n" https://example.comA total time near 15 seconds is the signature of a 522. A total time under a second with a 5xx status means you have a different error and the rest of this guide is the wrong tree to bark up.
Step 2: Try the Origin Directly
Get the IP address that your Cloudflare DNS record points to, then hit that server yourself, bypassing Cloudflare entirely. The --resolve flag makes curl connect to that IP while still sending the correct hostname and SNI:
# Replace 203.0.113.10 with the IP in your Cloudflare A record
curl -sv --connect-timeout 10 --resolve example.com:443:203.0.113.10 https://example.com -o /dev/null

# Plain HTTP version, useful if TLS is terminated by Cloudflare only
curl -sv --connect-timeout 10 --resolve example.com:80:203.0.113.10 http://example.com -o /dev/null
Read the result carefully, because it splits the problem cleanly:
| Result | What It Means | Go To |
|---|---|---|
| Hangs, then "Connection timed out" | The origin is silent for everyone, not just Cloudflare | Firewall or overload sections |
| Instant "Connection refused" | Nothing is listening on that port | DNS and ports section |
| Loads perfectly | The origin is healthy but blocks Cloudflare specifically | Firewall section (allowlisting) |
| Loads, but slowly and intermittently | The server is near capacity and dropping some connections | Overload section |
Step 3: Look at the Server Itself
SSH in and check whether requests are even arriving. This is the check most people skip, and it saves the most time:
# Watch the access log while you reload the site in a browser
tail -f /var/log/nginx/access.log

# Confirm something is actually listening on 80 and 443
ss -lntp | grep -E ':80 |:443 '

# Check load and memory
uptime
free -h

# Did the kernel kill anything for memory?
dmesg -T | grep -i -E 'oom|killed process' | tail
If nothing appears in the access log while the browser is timing out, the packets are not reaching your web server, and the cause is network layer: a firewall, a security group, or the wrong IP in DNS. If entries do appear but the response never gets back, you have a slow application rather than a blocked connection, and you are probably chasing a 524 instead.
Cause 1: Your Firewall Is Dropping Cloudflare
This is the most common cause by a wide margin, and it has a distinctive signature: your origin responds fine when you test it directly, but Cloudflare gets nothing. Something on the server or in front of it is silently discarding traffic from Cloudflare's address ranges.
It usually starts innocently. A security plugin bans an IP for too many requests, and because Cloudflare proxies all traffic, that IP is a Cloudflare edge server carrying thousands of legitimate visitors. Fail2ban, ConfigServer Security & Firewall, Imunify360, and WordPress security plugins all do this. So do cloud security groups that were locked down to a handful of office IPs and never updated.
Check for Existing Bans First
# List firewall rules and look for DROP entries on 80 or 443
iptables -L INPUT -n --line-numbers | head -40

# fail2ban: is a Cloudflare range currently banned?
fail2ban-client status
fail2ban-client status nginx-limit-req

# CSF, common on cPanel servers
csf -g 172.68.0.1
If you find a banned address that belongs to Cloudflare, unban it and then fix the underlying problem, which is that your security tools are reading the connecting IP instead of the real visitor IP. Install Cloudflare's real IP module or configure mod_remoteip so bans land on actual visitors.
Allowlist the Cloudflare Ranges
Cloudflare publishes its IP ranges at cloudflare.com/ips, and they change occasionally, so pull them live rather than pasting a list you found in a forum post from 2019:
# ufw (Ubuntu and Debian)
for ip in $(curl -s https://www.cloudflare.com/ips-v4); do
    ufw allow from "$ip" to any port 443 proto tcp
    ufw allow from "$ip" to any port 80 proto tcp
done
ufw reload

# iptables
for ip in $(curl -s https://www.cloudflare.com/ips-v4); do
    iptables -I INPUT -p tcp -s "$ip" --dport 443 -j ACCEPT
    iptables -I INPUT -p tcp -s "$ip" --dport 80 -j ACCEPT
done

# CSF: append the ranges to the allow file, then restart
curl -s https://www.cloudflare.com/ips-v4 >> /etc/csf/csf.allow
curl -s https://www.cloudflare.com/ips-v6 >> /etc/csf/csf.allow
csf -r
Do not forget IPv6. Cloudflare connects over IPv6 to origins that have an AAAA record, and a firewall that allows only the IPv4 ranges will produce 522s that look completely random because they depend on which protocol the edge chose.
Lock the door properly while you are here:
Once Cloudflare is allowlisted, consider denying everything else on ports 80 and 443. That stops attackers who discover your origin IP from bypassing Cloudflare entirely. Be aware of the trade-off: any external monitoring, webhook, or deployment check that hits your origin directly will also be blocked, so allowlist those sources too or point them at the proxied hostname.
Cloud Security Groups
If you are on AWS, Google Cloud, Azure, or DigitalOcean, the firewall that matters may not be on the server at all. Check the security group or cloud firewall attached to the instance and confirm inbound TCP on 80 and 443 is open to the Cloudflare ranges or to 0.0.0.0/0. Cloud firewalls drop by default rather than reject, which is exactly the behavior that yields a 522 rather than a 521.
One more provider level cause worth knowing: if your server is under attack, some hosts null route the IP address to protect their network. Your server is fine and your firewall is fine, but the address is unreachable from the outside. Nothing you configure on the box will fix that, so if everything looks correct, open a ticket with the host and ask directly whether the IP has been null routed or rate limited.
Cause 2: The Origin Ran Out of Capacity
The second most common cause. Nothing is blocked, the server is up, and the web server process is running. It simply cannot accept another connection. New connections queue in the kernel backlog, the backlog fills, and further connection attempts are dropped without a reply. From Cloudflare's point of view that is indistinguishable from a firewall drop, which is why 522s from overload get misdiagnosed so often.
The tell is intermittency. A firewall block is total and constant. Overload produces 522s that come and go, get worse at peak traffic, and clear after a restart for an hour or two before returning.
Find the Exhausted Resource
# Summary of socket states. A large "synrecv" count means the backlog is filling
ss -s

# Count established connections to the web server
ss -tn state established '( sport = :443 or sport = :80 )' | wc -l

# Is the connection tracking table full? A count near max means dropped packets
sysctl net.netfilter.nf_conntrack_count net.netfilter.nf_conntrack_max

# Listen backlog size
sysctl net.core.somaxconn

# PHP-FPM running out of workers
grep -i "max_children" /var/log/php*-fpm.log | tail
Each of these has a specific fix:
-
PHP-FPM hit pm.max_children: the log line "server reached pm.max_children setting" is definitive. Raise it in your pool config, but only if you have the memory. Calculate it as available RAM divided by the average process size, and check with
ps -ylC php-fpm --sort:rss. -
Nginx worker connections: raise
worker_connectionsin the events block and make sureworker_rlimit_nofileis high enough to match. -
Conntrack table full: raise
net.netfilter.nf_conntrack_maxin sysctl. A full table silently drops new connections and logs "nf_conntrack: table full" in dmesg. - Out of memory: if dmesg shows the OOM killer terminating processes, no amount of tuning helps. Either reduce memory use or size up the server.
- Database saturation: when every PHP worker is waiting on a slow query, workers stay busy and new connections queue. Check slow query logs and connection counts on the database before blaming the web tier.
Watch the Warning Signs Instead
Capacity problems announce themselves before they become outages. Response times drift from 300 milliseconds to 2 seconds over a few weeks, then one busy afternoon the queue tips over and Cloudflare starts serving 522s. If you are tracking response time, you get several weeks of warning. If you are only checking whether the homepage returns 200, you find out when it breaks.
A response time trend that climbs week over week is a capacity problem forming. Our response time monitoring guide covers what thresholds to watch.
Cause 3: DNS Records, Ports, and Keepalives
The DNS Record Points at the Wrong Server
Extremely common after a migration. You moved hosts, updated the A record at the old registrar, and forgot that Cloudflare holds its own copy of your DNS. Cloudflare is dutifully sending traffic to a server that was decommissioned last month. Nothing answers, and you get a 522 forever rather than intermittently.
Compare the record with reality. On the origin server:
# What is this server's actual public IP?
curl -s https://api.ipify.org; echo
Then open the Cloudflare dashboard, go to DNS, and check that the proxied A record for your domain matches that address exactly. Check the www record too. If your host uses a hostname rather than a fixed IP, use a CNAME so it follows changes automatically. A missing hostname on the certificate produces a different error entirely, covered in our certificate name mismatch guide.
The Origin Is Serving on a Port Cloudflare Does Not Proxy
Cloudflare's proxy only handles a specific set of ports on Free, Pro, and Business plans. For HTTP that includes 80, 8080, and 8880. For HTTPS it includes 443, 2053, 2083, 2087, 2096, and 8443. If your application listens on 3000 or 5000 with nothing in front of it, proxied traffic has nowhere to land.
The right fix is almost always to put Nginx or Apache in front of the application and let it listen on 443, proxying to your app port locally. That also gives you a place to terminate TLS, set headers, and serve static files.
Keepalives Are Disabled at the Origin
Cloudflare reuses connections to your origin rather than opening a new one per request. If keepalives are turned off, or the timeout is aggressively short, connections get closed underneath Cloudflare while it still considers them usable, and you see occasional 522s under load with no other symptoms.
# Nginx: in the http block. A value of 0 disables keepalives entirely
keepalive_timeout 75s;

# Apache: in httpd.conf or apache2.conf
KeepAlive On
KeepAliveTimeout 30
MaxKeepAliveRequests 1000
Test the config before reloading, every time. nginx -t or apachectl configtest takes a second and prevents turning an intermittent 522 into a permanent 521.
Cloudflare Settings and Managed Hosts
The Grey Cloud Test
Temporarily switching a DNS record from Proxied to DNS only removes Cloudflare from the path. If the site loads, the origin is healthy and the problem is between Cloudflare and your server. If it still fails, the origin is the problem and Cloudflare was only the messenger.
Two caveats before you do this: going grey cloud publishes your real origin IP address, and that address stays in public DNS history permanently, which weakens Cloudflare's DDoS protection afterwards. It also means the origin must present its own valid certificate for HTTPS. Use it as a short diagnostic, then switch back and change the origin IP later if the site is a likely attack target.
Cloudflare Tunnel Avoids the Problem Entirely
If firewall allowlisting keeps breaking, Cloudflare Tunnel inverts the connection. A lightweight daemon on your server opens an outbound connection to Cloudflare, and traffic flows back through it. No inbound ports need to be open at all, which removes the entire class of 522 caused by inbound filtering. The trade-off is another service to keep running, and if that daemon stops, you get a different error instead.
cPanel and Shared Hosting
On shared hosting you usually cannot edit firewall rules, and the host's own protection layer is often what is blocking Cloudflare. Two things are worth doing. First, ask support to allowlist the Cloudflare IP ranges for your account, referencing cloudflare.com/ips. Second, ask whether your account has hit a resource limit, because most shared hosts throttle or suspend accounts that exceed CPU or entry process limits, and a throttled account stops accepting connections in exactly the way that produces a 522.
WordPress Hosts and Security Plugins
On WordPress, the usual culprit is a security plugin blocking Cloudflare edge IPs after mistaking them for an attacker, or a managed host with its own WAF doing the same. If you can still reach wp-admin through a direct IP or a staging URL, disable the security plugin temporarily and see whether the 522s stop. Our WordPress uptime monitoring guide covers the other failure modes worth watching on WordPress specifically, and why a site keeps going down covers the recurring version of this problem.
How to Find Out Before Your Customers Do
The worst part of a 522 is not the fix. It is that the fix usually takes ten minutes and the error had been up for six hours before anyone noticed. Cloudflare does not email you when your origin stops answering. It just keeps serving the error page.
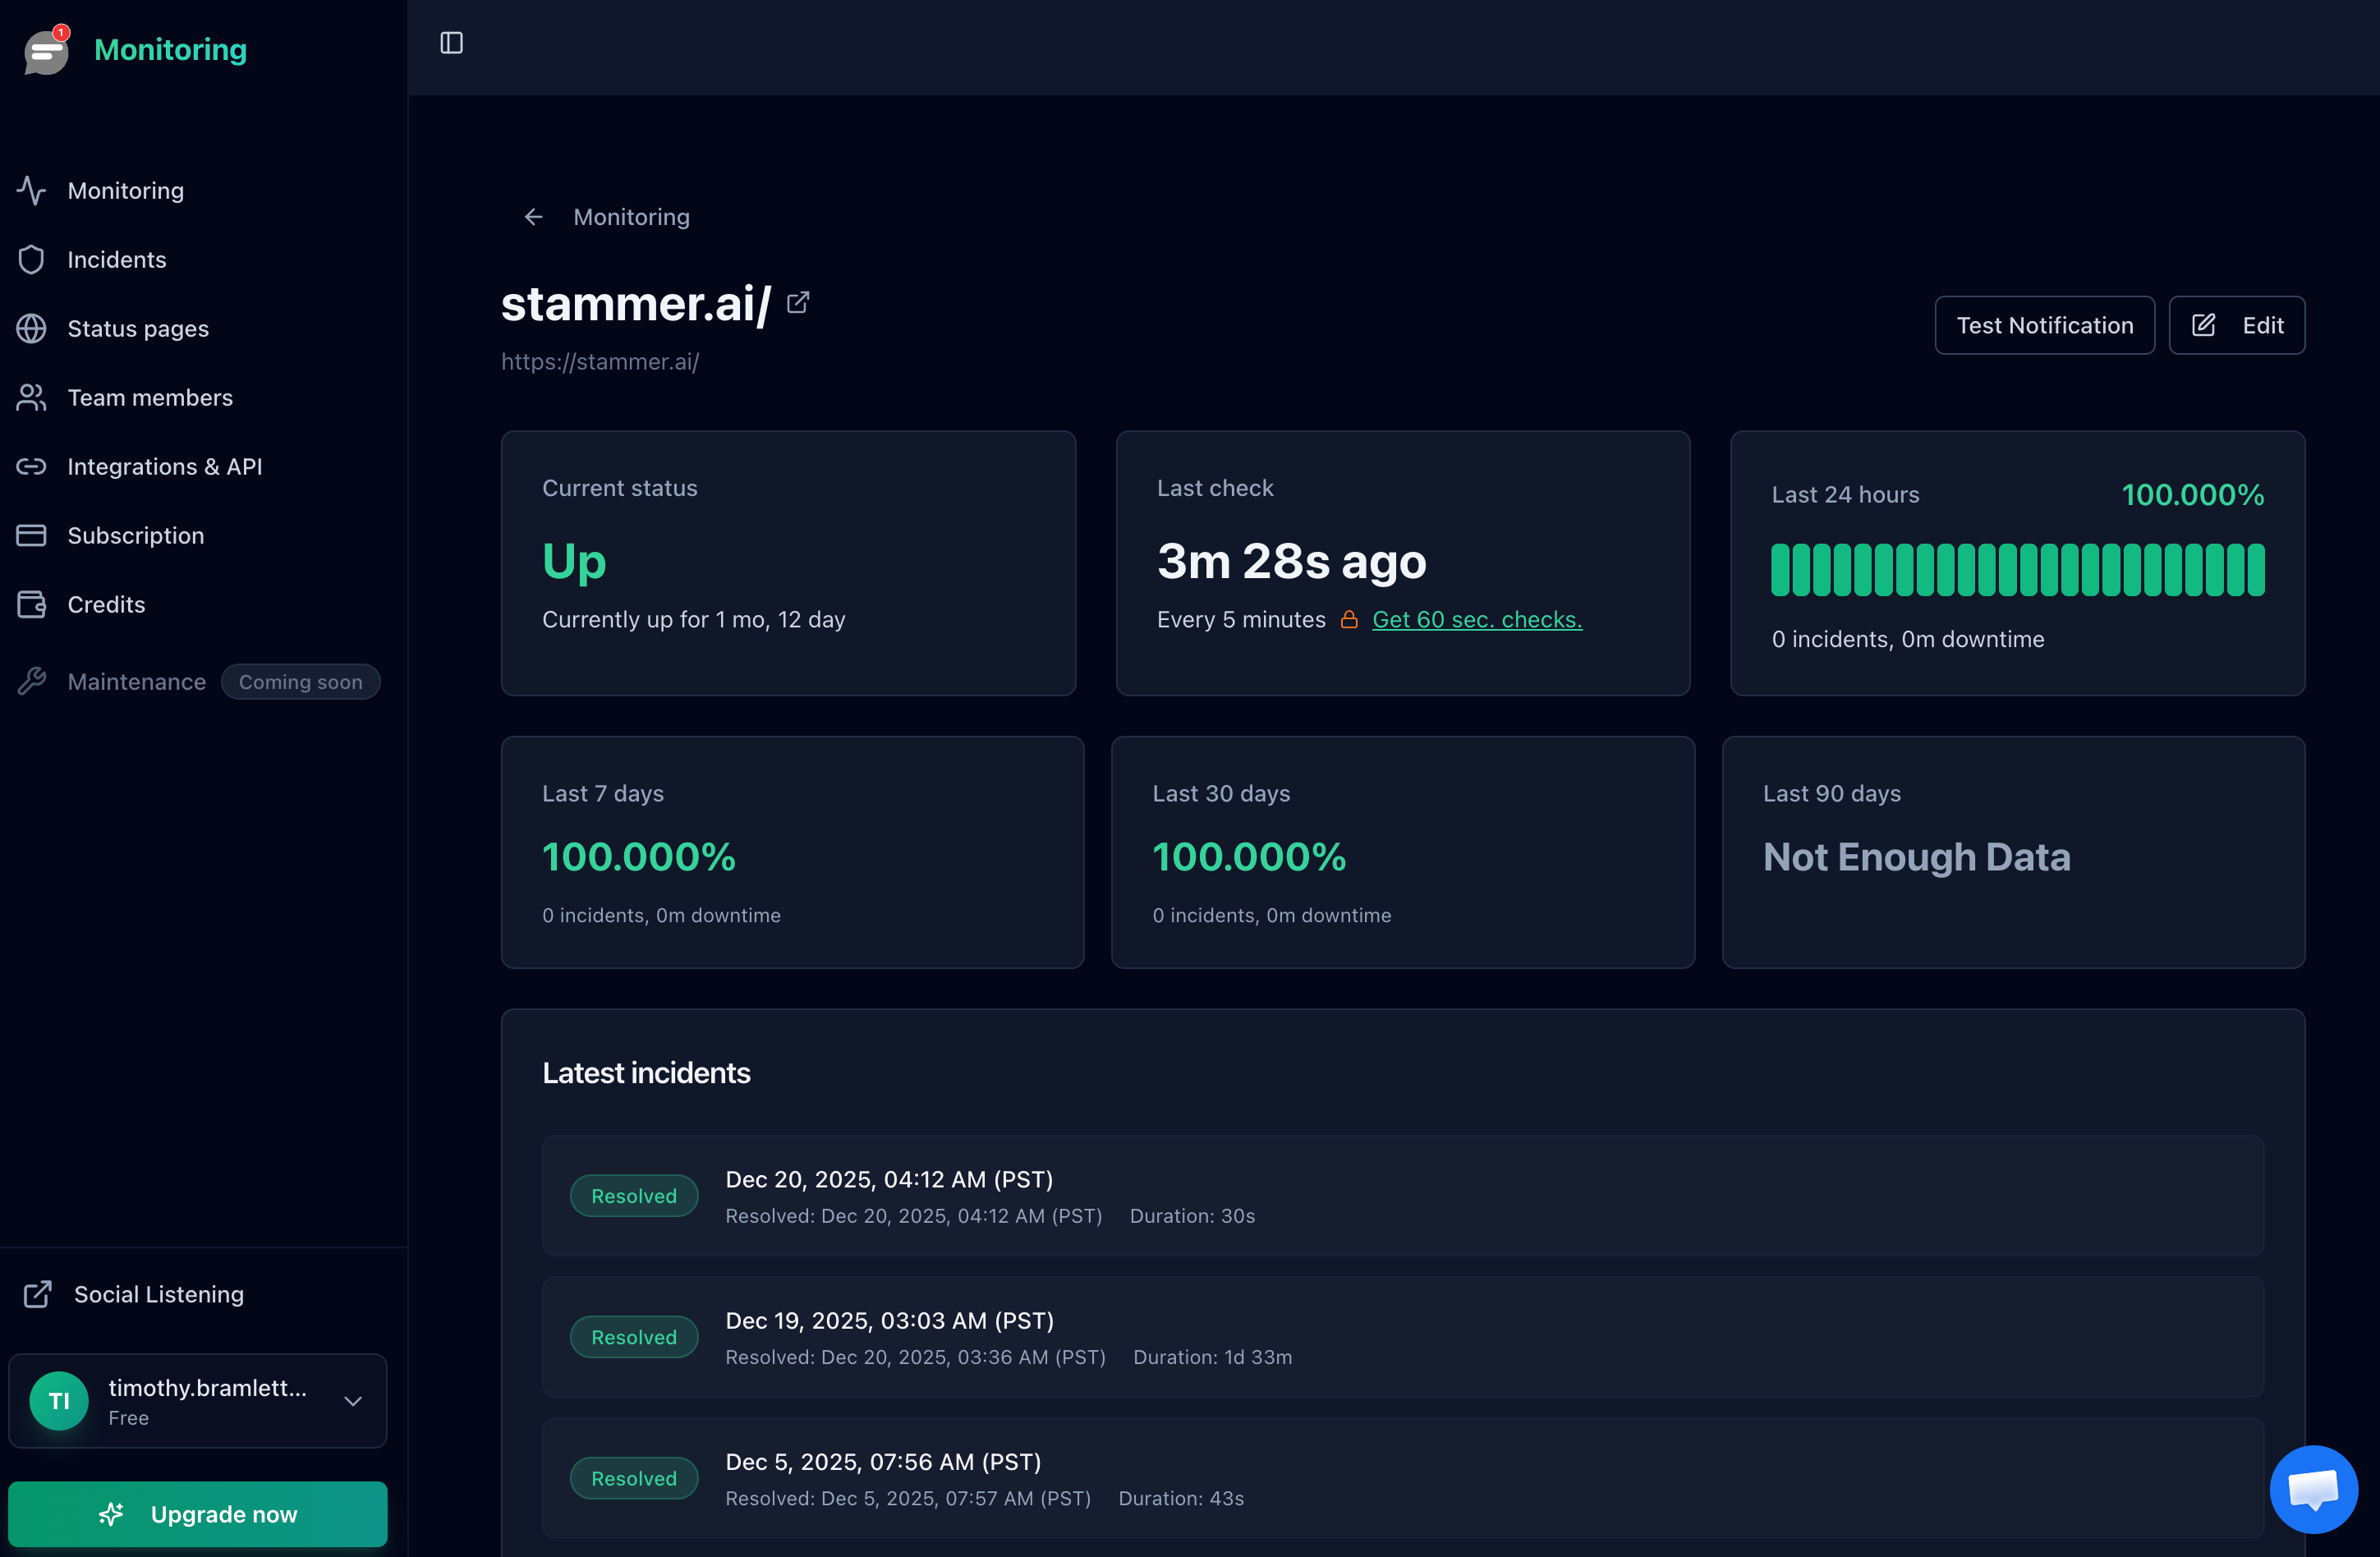
Because Cloudflare returns a genuine HTTP 522 status code, any uptime monitor that checks status codes catches it on the very next check. Add your public hostname as a monitor and you get an alert within a minute of the first failure rather than whenever a customer bothers to email you.

A non-2xx response, including Cloudflare's 522, flips the monitor to down on the next check.
Monitor Both Sides of the Proxy
A single monitor tells you the site is broken. Two monitors tell you where it broke, which is the difference between a ten minute fix and an hour of guessing:
-
The proxied hostname:
https://example.com. This is what visitors experience, and it is what turns red when a 522 starts. -
An unproxied origin hostname: create a DNS only record such as
origin.example.compointing at the same server and monitor that too. If the proxied monitor is down and the origin monitor is up, the problem is between Cloudflare and your server. If both are down, the server itself is the problem. Weigh this against the fact that it exposes the origin IP, and skip it if the site is a likely DDoS target. - Critical paths, not just the homepage: add a monitor for checkout, login, and any API your app depends on. Overload frequently takes down the heavy pages while the cached homepage keeps returning 200. The website monitoring checklist lists what else belongs on that list.
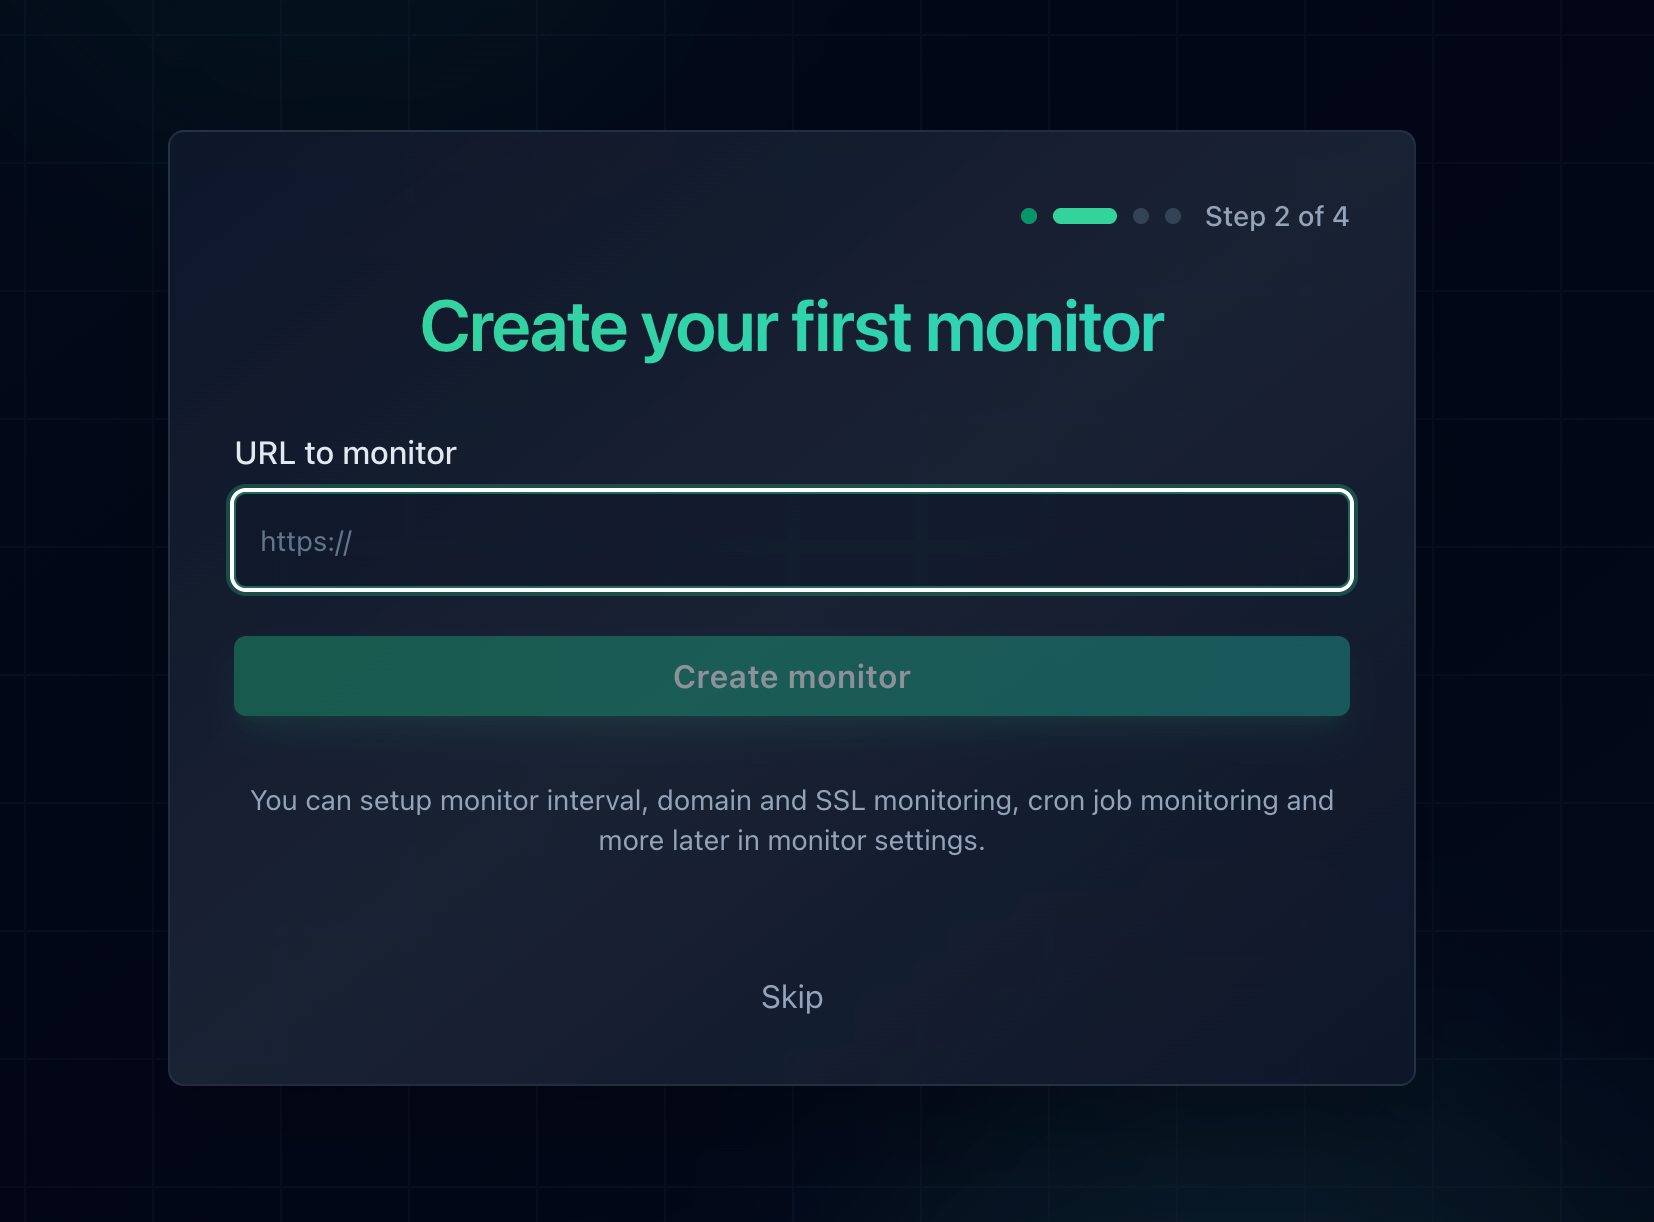
Adding a monitor takes about thirty seconds per URL.
Get the Alert Somewhere You Will See It
An email alert at 3 AM is worth nothing. For anything that makes money, use a channel that wakes you. Notifier sends email, SMS, phone call, and Slack alerts on every plan including the free tier, and SSL certificate monitoring and DNS monitoring are included at no extra cost, so the certificate errors in the 525 and 526 rows of the table above get caught by the same setup.
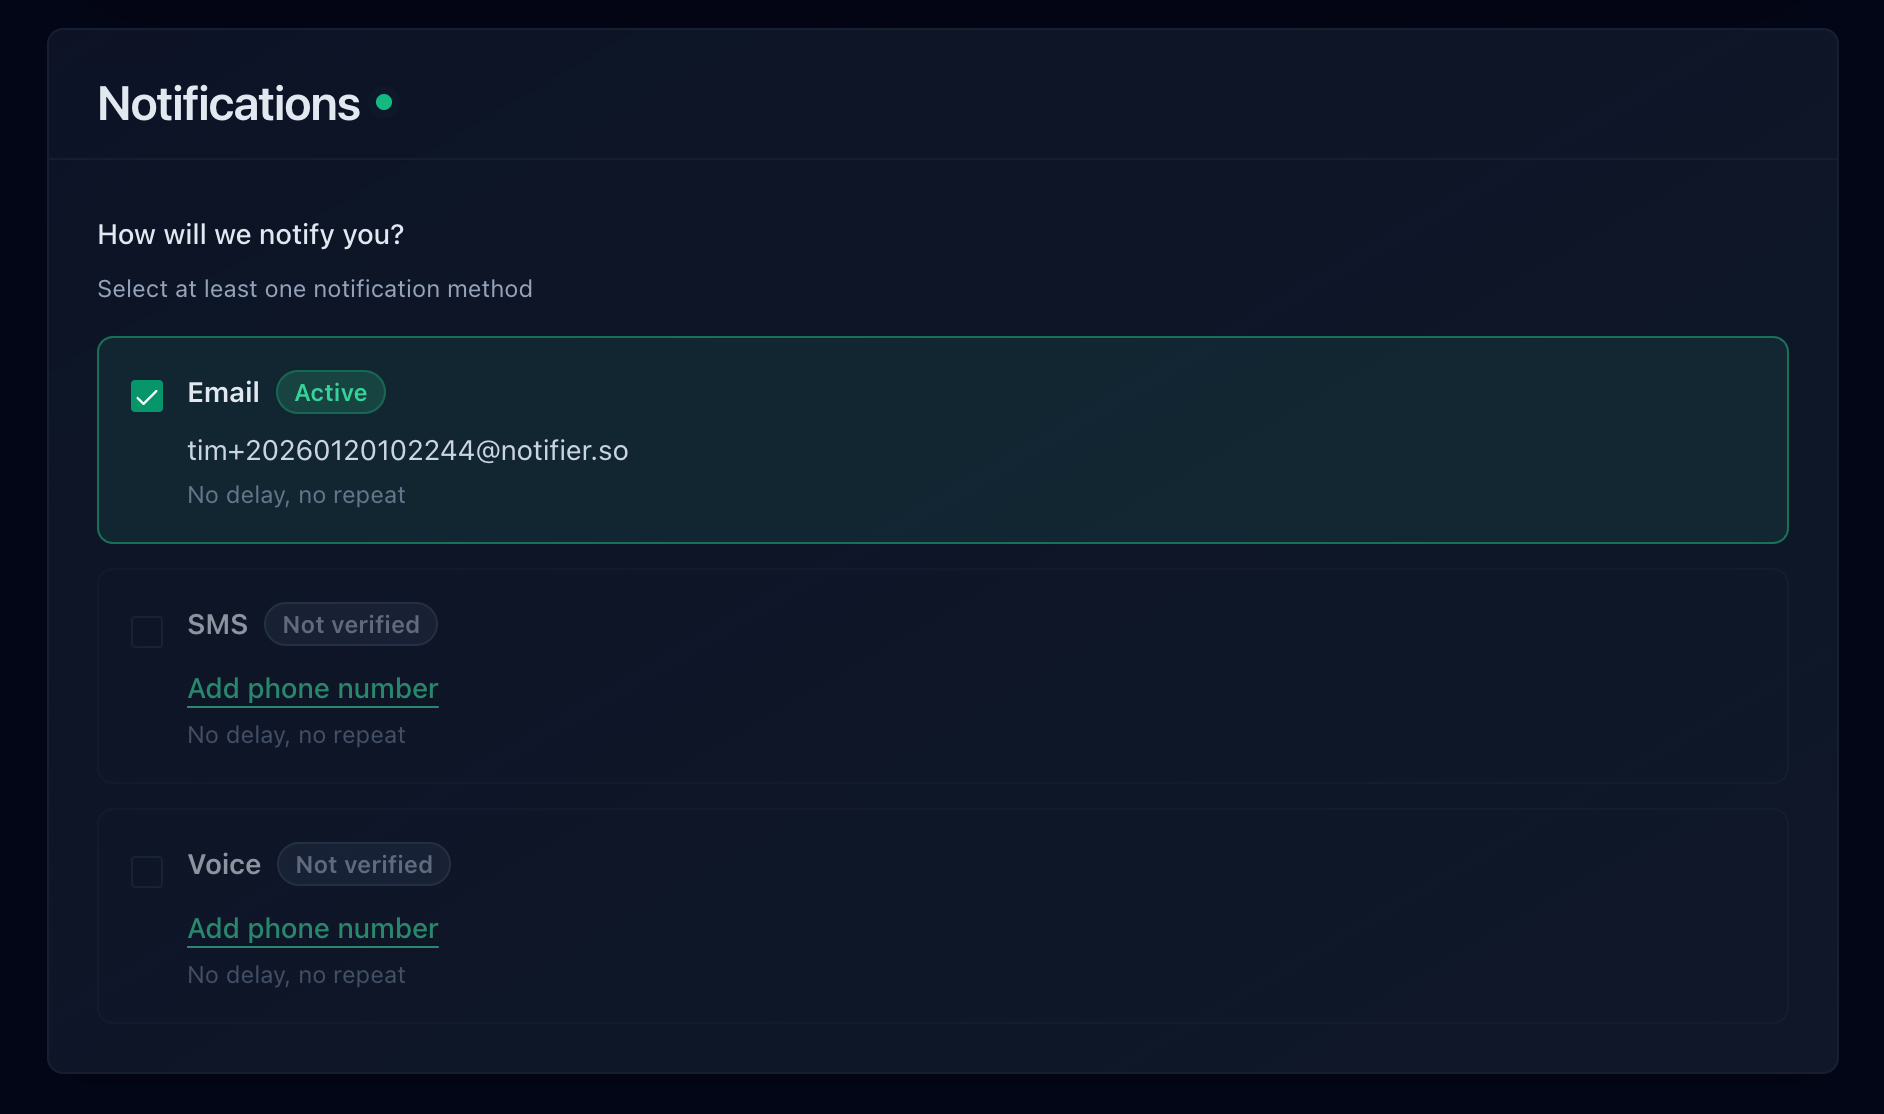
Email, SMS, phone call, and Slack are all available, including on the free plan.
How Quickly Each Tool Would Have Told You
Check interval is the number that matters for an error like this, because it sets your worst case detection delay. Here is how the common options compare on their free plans:
| Tool | Free Plan | Alert Channels on Free | Notes |
|---|---|---|---|
| Notifier | 10 monitors, 5 min checks, 5 status pages | Email, SMS, phone, Slack | SSL and DNS monitoring included on every plan. Free tier is fine for commercial use. Solo is $4/month for 20 monitors at 1 minute. |
| UptimeRobot | 50 monitors, 5 min checks, 1 status page | Free plan is non-commercial only. SMS and voice run on one-time credit bundles. Paid plans start at $8/month for 10 monitors. | |
| Better Stack | 10 monitors, 3 min checks, 1 status page | Email, Slack | Capable incident management, but pricing is per responder at $34/month and climbs quickly for a team. |
| StatusCake | 10 monitors, 5 min checks | Only 1 SSL monitor on free. The first paid tier is $24.49/month. | |
| Uptime Kuma | Unlimited, self-hosted | Many, via integrations | Free and flexible, but you host it, and it cannot alert you if it is running on the server that failed. |
Important: UptimeRobot restricted its free plan to non-commercial use only in October 2024. If the site behind Cloudflare belongs to a business or a client, that free tier is not an option. Notifier's free tier has no such restriction.
Pricing changes, so verify before you commit. Our comparison of free website monitoring tools goes through each free tier in detail, and how to set up website monitoring walks through the whole setup end to end.
Frequently Asked Questions
What is the difference between Cloudflare error 521 and 522?
Both mean Cloudflare could not fetch your page, but they fail differently. A 521 means your origin actively refused the connection, which happens when the web server is stopped, the port is closed, or a firewall rule rejects the traffic. It appears instantly. A 522 means your origin said nothing at all, so Cloudflare waited about fifteen seconds and gave up. Silence points at a dropped packet or a server too busy to answer, so start with firewall rules and server load rather than checking whether Nginx is running.
Is a 522 error Cloudflare's fault?
Almost never. The 522 page itself proves Cloudflare's edge is working, because something had to generate and serve that page to you. The error describes a failure on the leg between Cloudflare and the origin server, which is your infrastructure. The rare exception is a routing problem inside a single Cloudflare data center, which would show up as the site failing from one region while loading elsewhere, and would be listed on the Cloudflare status page.
Can I fix a 522 error as a visitor?
No. Clearing your cache, flushing DNS, or changing your resolver will not help, because none of your local state was involved in the failure. Wait a few minutes and reload, since many 522s are transient, and test on another network to check whether it is regional. If you need the site, contact the owner and include the Ray ID from the bottom of the error page so they can find the exact request in their logs.
Why does my site only show a 522 sometimes?
Intermittent 522s point at capacity rather than blocking. A firewall block is absolute, so it fails every request. If some requests succeed and others time out, your server is running out of something under load: PHP-FPM workers, memory, connection tracking entries, or database connections. Another cause of apparently random 522s is a firewall that allowlists Cloudflare's IPv4 ranges but not IPv6, so the outcome depends on which protocol the edge used.
Does pausing Cloudflare fix a 522?
It makes the error disappear, which is not the same as fixing it. Pausing Cloudflare or switching a record to DNS only sends traffic straight to your origin, so if the origin is healthy the site returns. That is a useful diagnostic, and it confirms the problem sits between Cloudflare and your server. But it publishes your origin IP address permanently and removes your DDoS protection, so treat it as a test rather than a solution.
How long does Cloudflare wait before returning a 522?
Roughly fifteen seconds for the connection to be established. That is separate from the response timeout, which is about 100 seconds on non-Enterprise plans and produces a 524 instead. If your error page appears after fifteen seconds you have a connection problem. If it appears after a minute or more on a request that had clearly started, you have a slow application and should be looking at long running queries and scripts.
Will uptime monitoring catch a Cloudflare 522?
Yes. Cloudflare returns the error with a real HTTP 522 status code rather than a 200 containing an error page, so any monitor that validates status codes flags it on the next check. With Notifier you would get an email, SMS, phone call, or Slack message within a minute on a paid plan, or within five minutes on the free tier. Adding a second monitor on an unproxied origin hostname also tells you immediately whether the origin or the edge is at fault.