At a Glance
- •Cloudflare error 520 means the connection to your origin worked and the request was delivered, but the response that came back was empty, truncated, or not valid HTTP, so Cloudflare could not forward it. Cloudflare, DNS, and your firewall are all working.
- •A 520 points at your outermost server layer, not your application code. If your app crashes, Nginx or Apache returns a 502 and Cloudflare passes that through unchanged, so debugging your PHP or Python first is the most common way to waste an afternoon on this error.
- •The four causes, in order: a connection closed before the response finished (keepalive races and OOM kills), response headers over Cloudflare's limit of roughly 32 KB (usually accumulated cookies), a response that is not valid HTTP, and a security tool resetting the connection.
- •Run 50 requests in a loop first. Constant 520s mean oversized headers or an invalid response, while intermittent 520s mixed with 200s mean crashes or memory pressure. Then hit the origin directly with curl and --resolve, since curl error 52, 56, or 18 names the exact failure.
- •Cloudflare returns a real HTTP 520 status code, so an uptime monitor catches it on the next check, which matters because intermittent 520s can run for weeks unreported. Notifier is free for 10 monitors with SSL and DNS monitoring included, and paid plans start at $4/month for 1-minute checks.
Error 520: Web server is returning an unknown error is the least helpful message Cloudflare produces, and that is not an accident. A 520 is the bucket Cloudflare drops a response into when it does not match any of the specific failures the other codes describe. Something came back from your server. Cloudflare could not make sense of it.
That vagueness is why most 520 articles are useless. They list every possible cause of downtime and tell you to clear your cache. This guide does something narrower and more useful: it starts from what a 520 rules out, which is most of the list, and then works through the four things that actually produce one, in the order they turn out to be responsible.
If you do not run the site, skip to the visitor section. It is short, because there is nothing on your end to fix.
What Cloudflare Error 520 Actually Means
To serve your visitor, Cloudflare has to complete a sequence: resolve your origin, open a TCP connection, negotiate TLS, send the request, then read back a response it can parse as valid HTTP and forward on. A 520 means every step up to the last one succeeded. The connection worked. The request was delivered. The reply was the problem.
Three things follow from that, and together they eliminate most of what you would otherwise go and check:
- Cloudflare is fine. Checking the Cloudflare status page is wasted effort. A 520 is generated at the edge precisely because the edge is working well enough to notice the problem.
- DNS and your firewall are fine. A blocked or misdirected connection produces a 521 or a 522, never a 520. Cloudflare got through to the right machine.
- Your application is probably fine too. This is the part that surprises people, and it is the most useful thing in this guide.
The insight that saves you an afternoon:
If your application code crashes, your web server catches it and returns a 502. Cloudflare then forwards that 502 to the visitor unchanged, because a 502 is a perfectly valid HTTP response. Cloudflare only invents a 520 when the process it is talking to directly, meaning Nginx, Apache, LiteSpeed, a load balancer, or a Node app exposed with no proxy in front of it, fails to produce parseable HTTP at all. So a 520 points at your outermost server layer, not at your PHP, Python, or Ruby code. Debugging the application first is the single most common way people lose hours on this error.
There are exactly four ways to fail that last step, and the rest of this guide is one section per way: the connection was closed before a complete response arrived, the response headers were too big for Cloudflare to accept, the response was not valid HTTP, or something in between reset the connection on purpose.
Cloudflare 520 to 526 Compared
Cloudflare's 5xx range is a set of codes describing which stage of the connection failed. Knowing which stage you are in tells you where to look, so confirm the number on the error page before you change anything.
| Error | What Failed | Timing Tell | Where to Look |
|---|---|---|---|
| 520 | Response arrived but was empty, truncated, or unparseable | Varies, often fast and often intermittent | Web server error log, OOM killer, cookie size |
| 521 | Origin refused the connection with a TCP reset | Under a second | Stopped service, wrong port, firewall REJECT |
| 522 | Origin never answered the connection attempt | About 15 seconds | Firewall DROP, security group, server out of capacity |
| 523 | Origin was unreachable at the network level | Fast | Wrong DNS record, routing, decommissioned host |
| 524 | Request delivered, response never finished in time | About 100 seconds | Slow query, external API call, work needing a queue |
| 525 | TLS handshake with the origin failed | Fast | Origin cipher and protocol config, missing 443 listener |
| 526 | Origin certificate failed validation | Fast | Expired or untrusted origin certificate, Full (strict) mode |
One pattern separates 520 from the rest of the family. The others are usually all or nothing: when you have a 522 or a 521, the whole site is down and stays down until you fix it. A 520 is frequently intermittent, hitting a fraction of requests while the site otherwise looks healthy. That intermittency is itself a clue, and it is why 520s so often get dismissed as a fluke for weeks before anyone investigates.
If You Are Just Trying to Visit the Site
There is no client side fix for a 520, and this is worth saying plainly because most of the advice you will find says otherwise. Clearing your cache, flushing DNS, switching to 1.1.1.1, restarting your router, and disabling your VPN cannot help. None of your local state took part in the failure. Cloudflare successfully reached someone else's server and got back something it could not read.
Two things are worth doing:
- Reload after a minute or two. Because 520s are often intermittent, a reload genuinely does work a surprising amount of the time. That is not a fix, it is just a different request landing on a healthy worker.
- Send the owner the Ray ID. The error page prints one at the bottom. It identifies your exact request in Cloudflare's logs and lets the owner match your failure to a single entry rather than guessing.
If you want to confirm the problem is not local before contacting anyone, our guide on whether a site is down for everyone or just you covers the checks worth running.
Diagnose It in Three Steps
Because a 520 is a catch all, the goal of diagnosis is to convert it into a specific failure you can name. Three steps do that.
Step 1: Confirm it is a 520, and whether it is constant
Never trust the rendered page. Read the status code, and read it fifty times, because the constant versus intermittent split immediately halves your search space:
for i in $(seq 1 50); do
  curl -s -o /dev/null -w "%{http_code} %{time_total}s\n" https://example.com/
  sleep 1
done | sort | uniq -c | sort -rn
If every line is a 520, you are looking at something deterministic: oversized headers on that route, a non HTTP listener, or a server that emits invalid HTTP on every request. If 520s are mixed in with 200s, you are looking at something that depends on load or on which worker handled the request, which points at crashes and resource pressure.
Step 2: Bypass Cloudflare and talk to the origin yourself
Reproduce what Cloudflare does. Point curl at the origin IP while still sending the correct hostname and SNI, so you hit the same virtual host Cloudflare hits:
# Replace 203.0.113.10 with your real origin IP
curl -svo /dev/null --resolve example.com:443:203.0.113.10 https://example.com/

# Repeat it, since an intermittent failure needs volume to show up
for i in $(seq 1 100); do
  curl -s -o /dev/null -w "%{http_code}\n" --resolve example.com:443:203.0.113.10 https://example.com/
done | sort | uniq -c
What curl says here is the most valuable output in the whole process, because curl reports the underlying failure instead of hiding it behind a generic page:
| curl Output | What It Means | Go To |
|---|---|---|
| curl: (52) Empty reply from server | Connection opened, then closed with zero bytes sent back | Closed mid response |
| curl: (56) Recv failure: Connection reset by peer | Something tore the connection down after data started flowing | Security tools |
| curl: (18) transfer closed with N bytes remaining | Content-Length promised more than was delivered | Malformed responses |
| curl: (1) Received HTTP/0.9 when not allowed | Whatever is on that port is not speaking HTTP | Malformed responses |
| 200 every time, headers look huge | curl accepts headers Cloudflare rejects | Oversized headers |
Do not test with curl localhost. A request from the machine to itself skips the public interface, the firewall, and often TLS entirely, so it can succeed while every request from Cloudflare fails. Always use --resolve against the public IP, from somewhere other than the server.
Step 3: Read the web server error log, not the access log
The access log records requests that produced a response. A 520 is frequently a request that produced no response, so it may not appear there at all. The error log is where the evidence lives:
# Nginx
sudo tail -n 200 /var/log/nginx/error.log

# Apache
sudo tail -n 200 /var/log/apache2/error.log     # Debian and Ubuntu
sudo tail -n 200 /var/log/httpd/error_log       # RHEL, Alma, Rocky

# The service journal, which catches crashes the log file misses
sudo journalctl -u nginx --since "1 hour ago"

# The kernel, which is the only place an OOM kill is recorded
sudo dmesg -T | grep -i -E "killed process|out of memory"
Lines worth reacting to immediately: worker process exited on signal 11 is a segfault, upstream sent too big header is the header case, and anything from the OOM killer explains an intermittent 520 completely on its own.
Cause 1: The Connection Closed Before the Response Finished
This is the most common cause, and it is the one behind almost every intermittent 520. Cloudflare sent a request, the connection was accepted, and then it closed without a complete response ever arriving. Curl error 52 is the signature.
The keepalive race, which almost nobody checks
Cloudflare reuses connections to your origin rather than opening a new one per request. If your server closes an idle connection at the same moment Cloudflare sends a request down it, the request lands on a socket that is already going away, and Cloudflare sees an empty reply. That produces a low rate of 520s that correlates with traffic patterns and nothing else, which is maddening to chase.
The fix is to make your origin hold idle connections open longer than Cloudflare's idle window rather than shorter. Nginx defaults to 75 seconds, which is too aggressive here:
# Nginx, inside http { }
keepalive_timeout 300s;
keepalive_requests 10000;

# Apache, in apache2.conf or httpd.conf
KeepAlive On
KeepAliveTimeout 300
MaxKeepAliveRequests 10000
The same race happens one layer out if you sit behind a load balancer. An AWS ALB with a 60 second idle timeout in front of an app with a 5 second keepalive will generate exactly this pattern. The rule is that each layer should hold connections open longer than the layer in front of it.
The OOM killer
When a Linux box runs out of memory, the kernel picks a process and kills it outright. If that process was mid response, the connection dies with no HTTP at all. Nothing appears in the access log. This is the cleanest explanation for 520s that cluster around traffic peaks:
# Was anything killed, and when?
sudo dmesg -T | grep -i "killed process"

# Current headroom, including swap
free -h

# What is actually consuming it
ps aux --sort=-%mem | head -12
The real fix is usually capping concurrency rather than adding memory. A PHP-FPM pool with pm.max_children set high enough that peak traffic exceeds physical RAM will OOM reliably every time you get busy. Set it to available memory divided by the average process size, and add swap so the kernel has somewhere to go before it starts killing things.
Segfaults in the web server itself
A crash inside the outermost server, rather than inside your app, hands Cloudflare a dead connection. Look for worker process exited on signal 11 in the Nginx error log or child pid exit signal Segmentation fault in Apache's. The usual culprits are third party modules: an image processing module on a malformed upload, an aggressive ModSecurity rule set, or a Brotli or PageSpeed build mismatched against the server version. Disable recently added modules one at a time and see which one stops the crashes.
Apps exposed to Cloudflare with no proxy in front
If Cloudflare talks straight to a Node, Gunicorn, or Docker process with no Nginx in between, then every unhandled exception that kills the process becomes a 520 rather than a 502, because there is nothing left to translate the crash into HTTP. Putting a reverse proxy in front does not make the crashes stop, but it converts them into logged 502s with a stack trace, which is a far better place to debug from. Our guide on fixing 502 bad gateway errors picks up from there.
Cause 2: Response Headers Too Large
This is the cause that produces a constant, perfectly reproducible 520 on one route while the rest of the site is fine, and it is the one people almost never guess. Cloudflare enforces a ceiling on response headers: roughly 32 KB in total, with any single header line limited to about 16 KB. Exceed it and the response is rejected as unparseable, which surfaces as a 520.
Curl will happily accept those same headers, so the origin looks perfectly healthy when you test it. That mismatch is the whole reason this cause is so hard to find. Measure the headers instead of eyeballing them:
# Total response header size in bytes
curl -sSI --resolve example.com:443:203.0.113.10 https://example.com/ | wc -c

# The biggest individual headers, largest first
curl -sSI https://example.com/ | awk '{ print length($0), $0 }' | sort -rn | head -5

# How many Set-Cookie headers is this route emitting?
curl -sSI https://example.com/ | grep -ci "^set-cookie"
Anything over about 16 KB in total is a problem waiting to happen, and anything approaching 32 KB is your answer. The usual sources, in order:
- Cookie accumulation. A session cookie per plugin, per analytics tool, and per A/B test adds up. WooCommerce carts, marketing suites, and consent managers are frequent offenders, and cookies keep being resent until they expire, so the problem compounds silently over months.
- A whole JWT stored in a cookie. A token with a fat claims payload can be several KB on its own. Store a session ID in the cookie and keep the token server side.
- Error details leaking into headers. Some frameworks in debug mode attach stack traces or query dumps to response headers. It works locally and breaks in production behind Cloudflare.
- Enormous Link headers. Preload hints generated per asset can produce a single header line thousands of characters long on an asset heavy page.
If an internal proxy sits in front of the app, it needs enough buffer to pass large headers through, otherwise you get the upstream sent too big header error before Cloudflare ever sees them:
# Nginx, in the server or location block
proxy_buffer_size    16k;
proxy_buffers        8 16k;
proxy_busy_buffers_size 32k;

# For FastCGI backends such as PHP-FPM
fastcgi_buffer_size  16k;
fastcgi_buffers      8 16k;
Raising those buffers is a workaround, not a fix. It lets bigger headers through your own stack and straight into Cloudflare's limit. The real fix is shrinking what you emit: audit your cookies, drop the ones nothing reads, move payloads server side, and set explicit expiries so stale cookies age out.
Cause 3: The Response Is Not Valid HTTP
Cloudflare parses strictly. Browsers and curl are forgiving, so a technically invalid response can work in your browser for years and still be rejected the moment Cloudflare is in the path. Four variants account for nearly all of these.
Output printed before the headers
In PHP, a stray blank line after a closing tag, a BOM saved into a config file, or a plugin echoing a warning all send bytes down the socket before the headers do. The result is a response whose first line is not a status line. In WordPress this classically comes from a newly edited theme file or a plugin misbehaving at activation. Find it by checking the very first bytes of the response:
curl -sv https://example.com/ 2>&1 | head -25

# Hunt for files with a byte order mark or trailing whitespace
grep -rl $'\xEF\xBB\xBF' /var/www/html --include="*.php"
A Content-Length that does not match the body
If the header promises 50,000 bytes and 32,000 arrive, Cloudflare treats the response as truncated. Curl reports this as error 18. The usual causes are a script exiting early after output has started, a compression module recalculating the body without updating the length, and manual header setting in application code. Let the web server compute Content-Length, and set your own only when you are certain of the byte count after all filters have run.
Invalid characters in header values
Header values must be ASCII with no raw newlines. Reflecting user controlled data into a header, a filename with an accent in a Content-Disposition, or a stray carriage return will all produce something Cloudflare refuses to parse. Sanitize anything you interpolate into a header, and encode filenames rather than passing them through raw.
Something on the port that is not a web server
If curl says Received HTTP/0.9 when not allowed, whatever answered is not speaking HTTP. This shows up after a port change, when a Docker port mapping lands on the wrong container, or when a raw TCP service ends up on 8080. Confirm what owns the port:
sudo ss -tlnp | grep -E ':(80|443|8080|8443)\b'
sudo docker ps --format "table \t"
Also worth checking: plain HTTP being served on 443. If Cloudflare negotiates TLS on a port that answers in cleartext, nothing about the exchange will parse. Our ERR_SSL_PROTOCOL_ERROR guide covers that mismatch in depth.
Cause 4: Something Is Resetting the Connection on Purpose
Curl error 56, connection reset by peer, means a complete connection was deliberately torn down partway through. Unlike a 521, where the connection is refused up front, here it was accepted first and killed later, which is the behavior of a security layer that inspects a request and then decides it does not like it.
- ModSecurity and hosted WAFs. A rule set configured to drop rather than return a 403 will reset the connection instead. Check
/var/log/modsec_audit.logand correlate the timestamp with your failing request. If a rule is firing on legitimate traffic, whitelist that rule ID for that path rather than disabling the whole engine. - Imunify360, BitNinja, and cPanel security stacks. These reset connections from IPs they consider hostile. Because every request behind Cloudflare arrives from a Cloudflare edge address, one bad request can get an edge node flagged, and that node serves thousands of your visitors. The permanent fix is a real IP configuration, using
set_real_ip_fromwithreal_ip_header CF-Connecting-IPon Nginx, or mod_remoteip on Apache, so decisions are made about real visitors. - Rate limiting at the host level. Shared hosts frequently cap concurrent connections per account. Because Cloudflare pools connections, all of your traffic can appear as a small number of very busy connections, which trips limits designed for individual browsers. Ask your host to confirm the per account connection cap.
- Connection tracking tables filling up. A firewall whose conntrack table is full starts dropping and resetting established connections.
dmesgreportsnf_conntrack: table full, dropping packetwhen this happens.
The same reset seen from a browser instead of from Cloudflare's edge is covered in our ERR_CONNECTION_RESET guide, including the MTU and TLS inspection cases.
Cloudflare Settings and Managed Hosts
The grey cloud test, and why to be careful with it
Turning off the orange cloud on a DNS record takes Cloudflare out of the path entirely. If the 520 disappears, the failure is specific to how your origin responds to Cloudflare, which points at headers or keepalives. If the site breaks differently, the origin was already unhealthy.
Understand the cost first. Grey clouding publishes your real origin IP address in public DNS, and passive DNS services record it permanently. Once it is out, attackers can bypass Cloudflare and hit your server directly forever, and changing the IP is the only way to undo it. Use a temporary subdomain such as origin-test.example.com for the test, and plan to change the origin IP afterwards if the site is a likely target.
Cloudflare Tunnel
A Tunnel replaces inbound connections with an outbound connection from a lightweight daemon on your server. That removes the whole class of edge to origin connection problems: no ports exposed, no IP ranges to allowlist, no keepalive race with the public internet, and no origin IP to leak. It does not help with oversized headers or invalid HTTP, since those are produced by your application either way, but it eliminates most of section one and all of section four.
Shared hosting, cPanel, and managed WordPress
On a plan where you cannot read the error log or restart services, your diagnostic reach is limited, and that is genuinely frustrating on an error this vague. Two things still work. Run the fifty request loop from step one and record the exact timestamps of the failures, then open a ticket asking specifically whether processes were killed for exceeding resource limits during those windows. Support can see the entry process and memory limit kills that you cannot, and phrasing the question that precisely usually gets a real answer instead of a cache clearing script.
On managed WordPress platforms such as WP Engine, Kinsta, and Cloudways, there is already a proxy layer in front of your site, so a plugin fatal error normally becomes a 502 rather than a 520. A 520 on those hosts usually means cookies. Deactivate plugins in batches and re-measure the header size after each batch. Our WordPress uptime monitoring guide covers the wider set of WordPress failure modes.
How to Catch the Next One in a Minute Instead of a Week
The 520 has an unusual property among Cloudflare errors: because it is often intermittent, it can run for weeks before anyone reports it. A visitor who hits one reloads, gets a working page, and assumes their connection glitched. Meanwhile some percentage of your traffic, including signups and checkouts, is quietly failing.
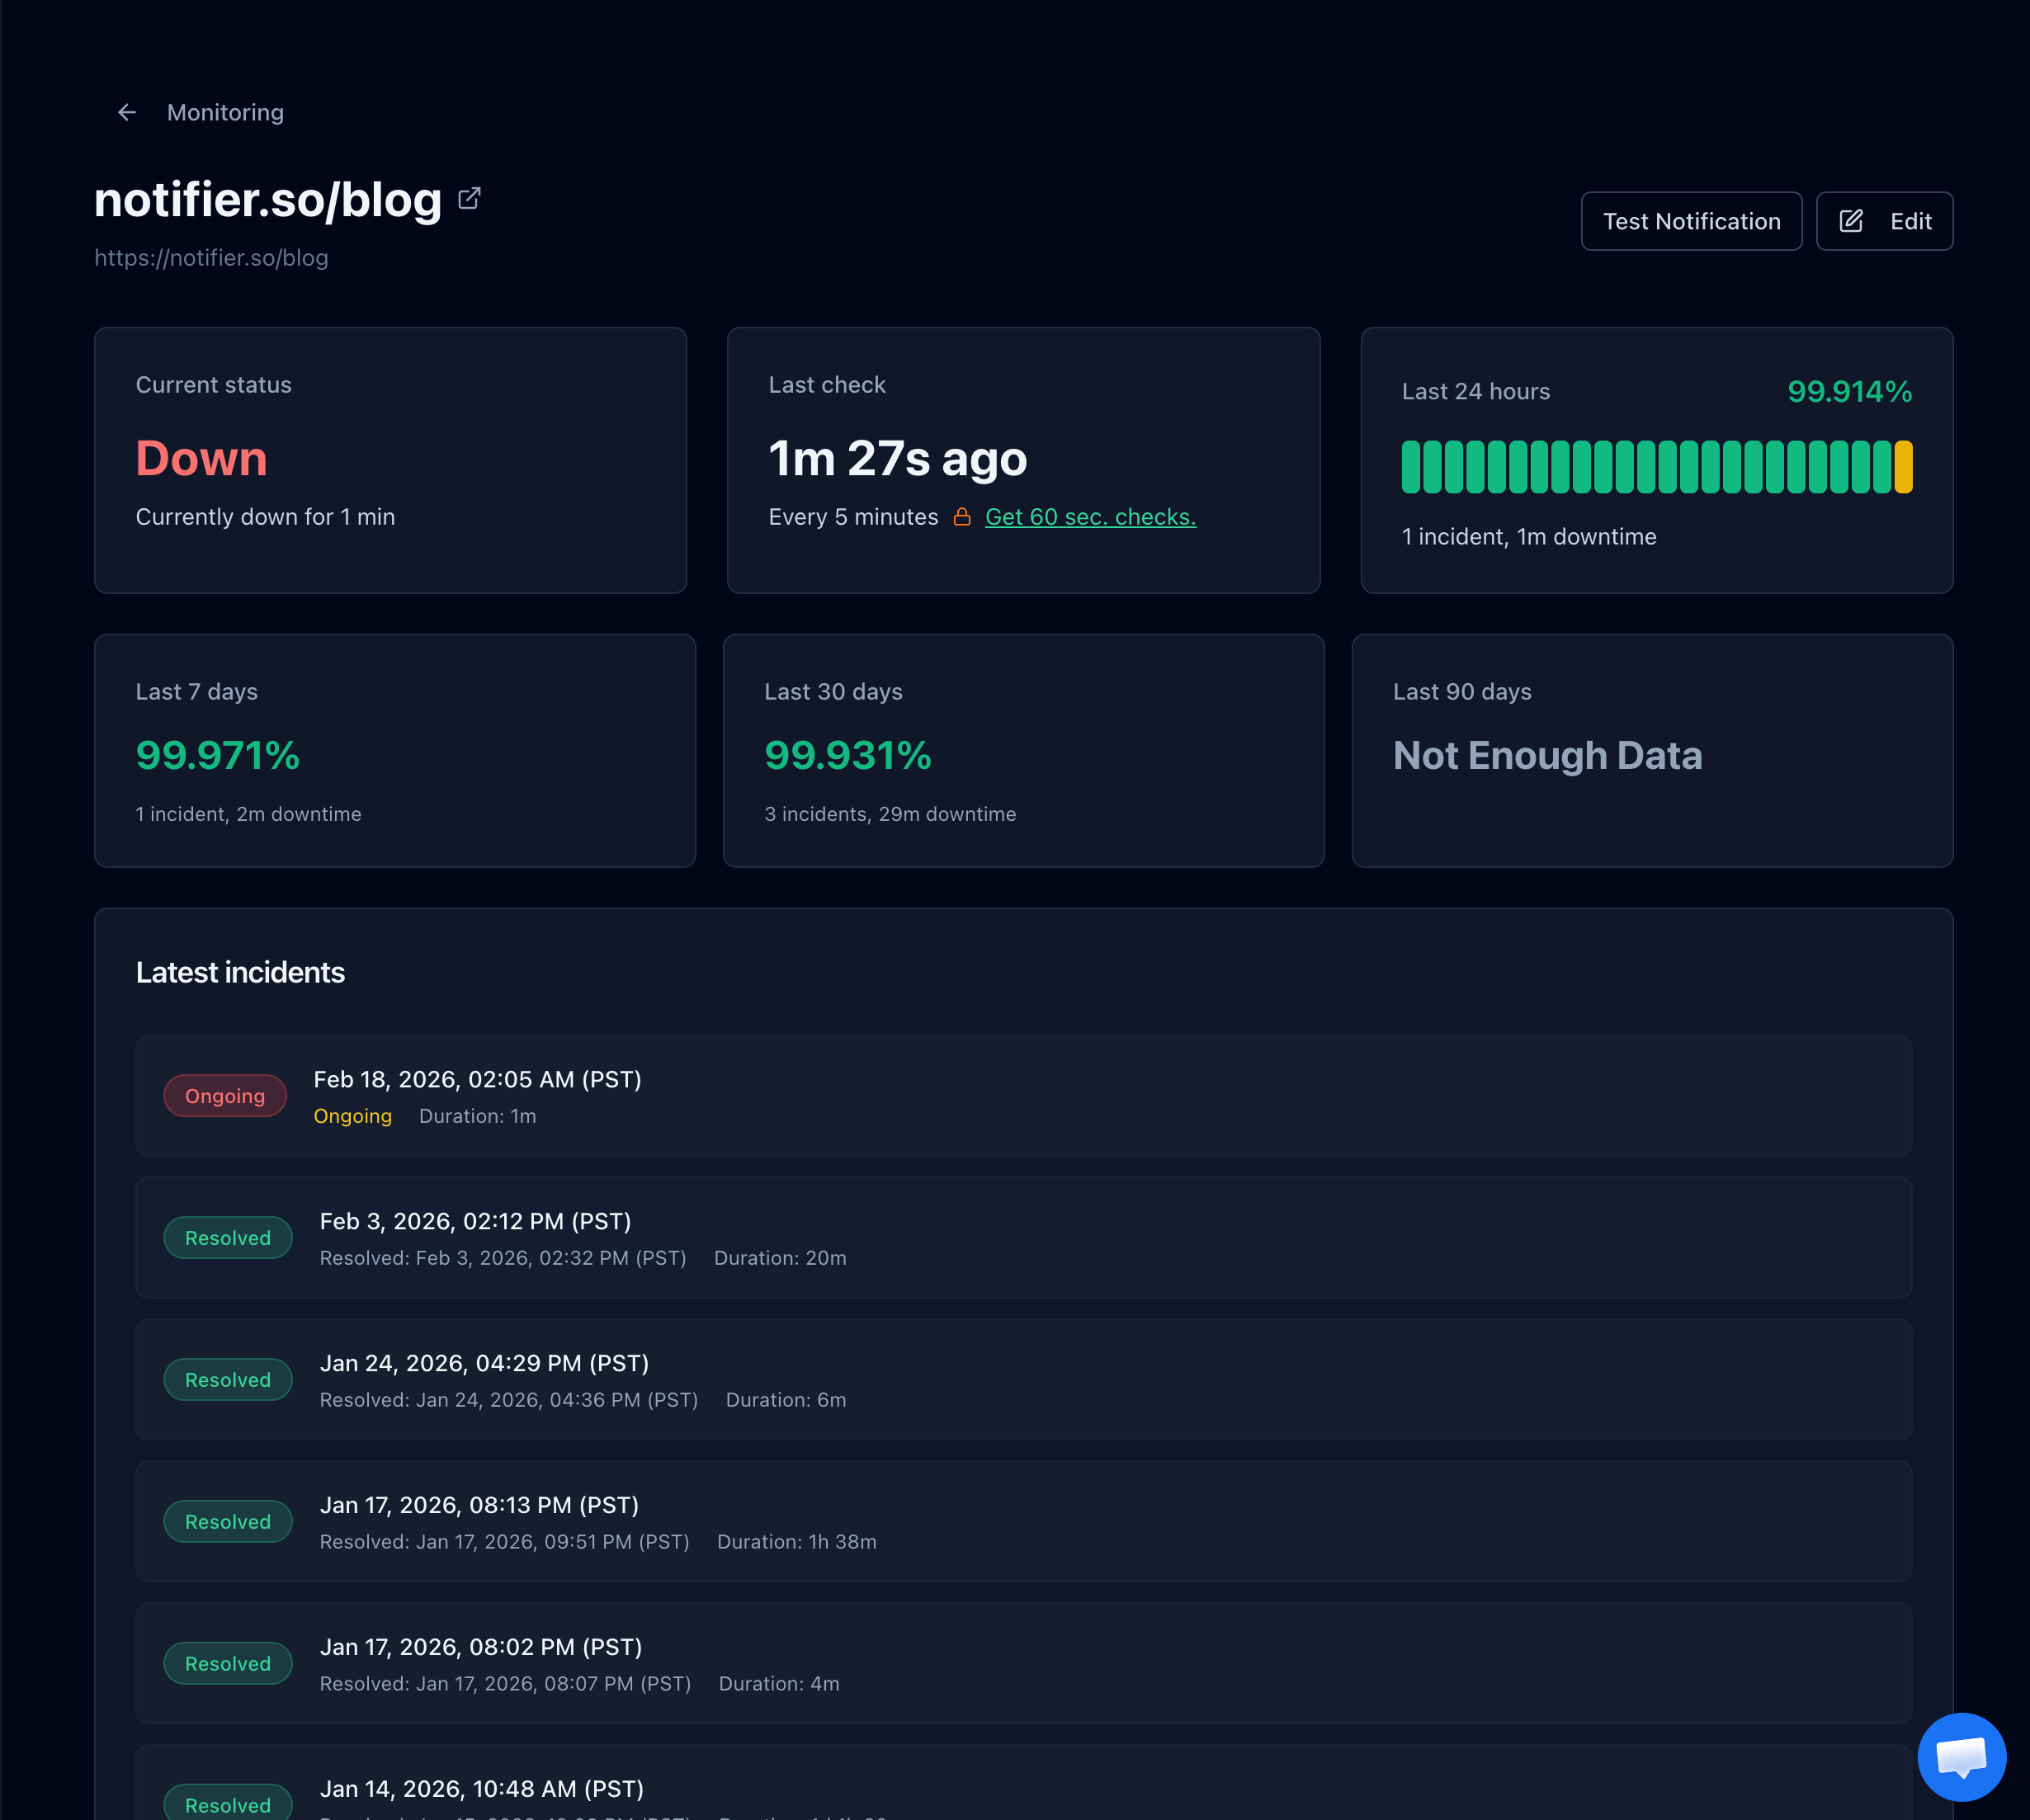
Uptime monitoring solves the detection half of that. Cloudflare returns a genuine HTTP 520 status code rather than a 200 with an error page in it, so any monitor that validates status codes flags it on the very next check.
Monitor both sides of the proxy
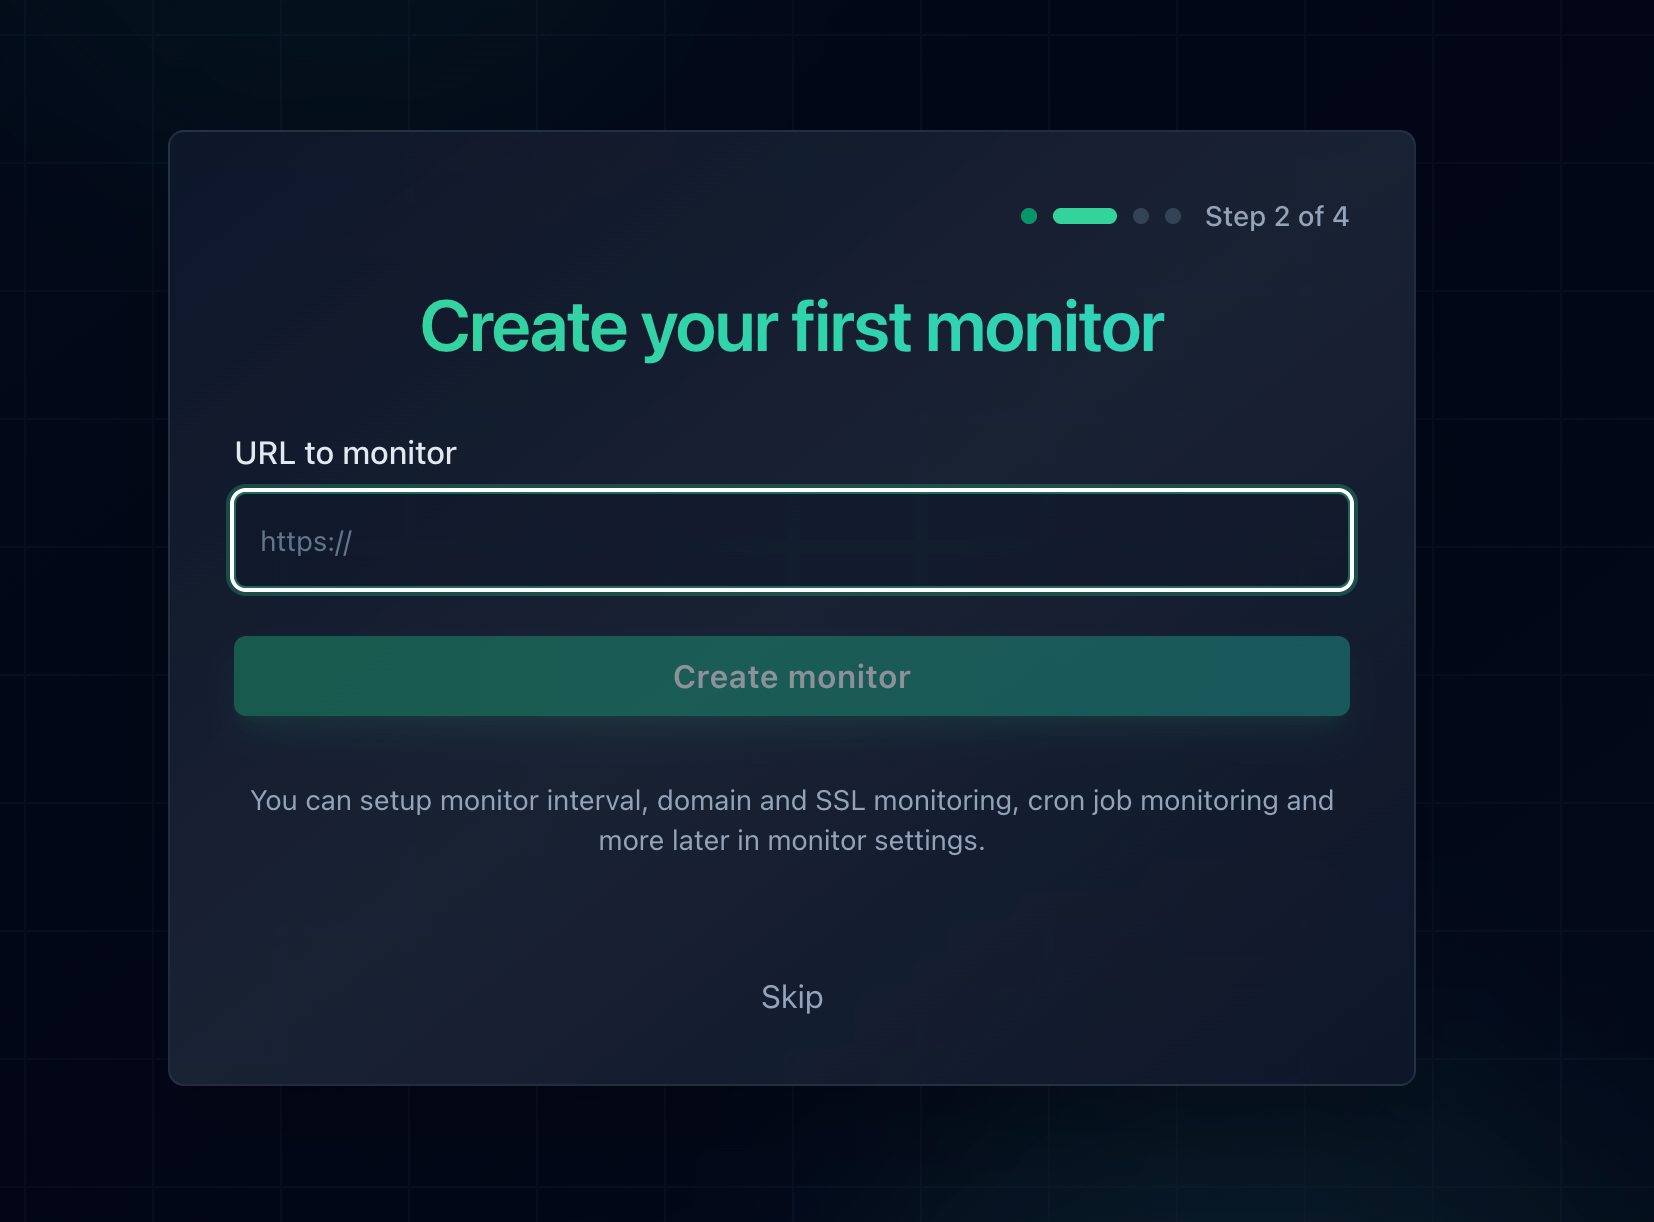
One monitor tells you the site is broken. Two monitors tell you where. Point the first at your normal proxied hostname, the way visitors reach it, and the second at an unproxied hostname resolving to the origin. Then the alert itself narrows the problem before you have opened a terminal:
- Proxied fails, origin passes: the origin only misbehaves toward Cloudflare, which means headers or keepalives.
- Both fail: the origin is genuinely unhealthy, so go to the error log and the OOM killer.
- Proxied passes, origin fails: Cloudflare is serving cached content over a broken origin, which is a warning you would otherwise get much later.
The trade off is the same as the grey cloud test: an unproxied hostname exposes the origin IP. It is the right call for most sites and the wrong call for a site under active attack. Decide deliberately rather than by accident.
Monitor more than the homepage
Header driven 520s hit specific routes, and the routes they hit are the ones that set the most cookies: login, cart, checkout, account pages, and authenticated API endpoints. A homepage that is served from cache will keep returning 200 while your checkout returns 520 to every logged in customer. Put a monitor on each path that earns money, not just on the front door. Our API endpoint monitoring guide covers what else is worth checking on an endpoint beyond the status code.
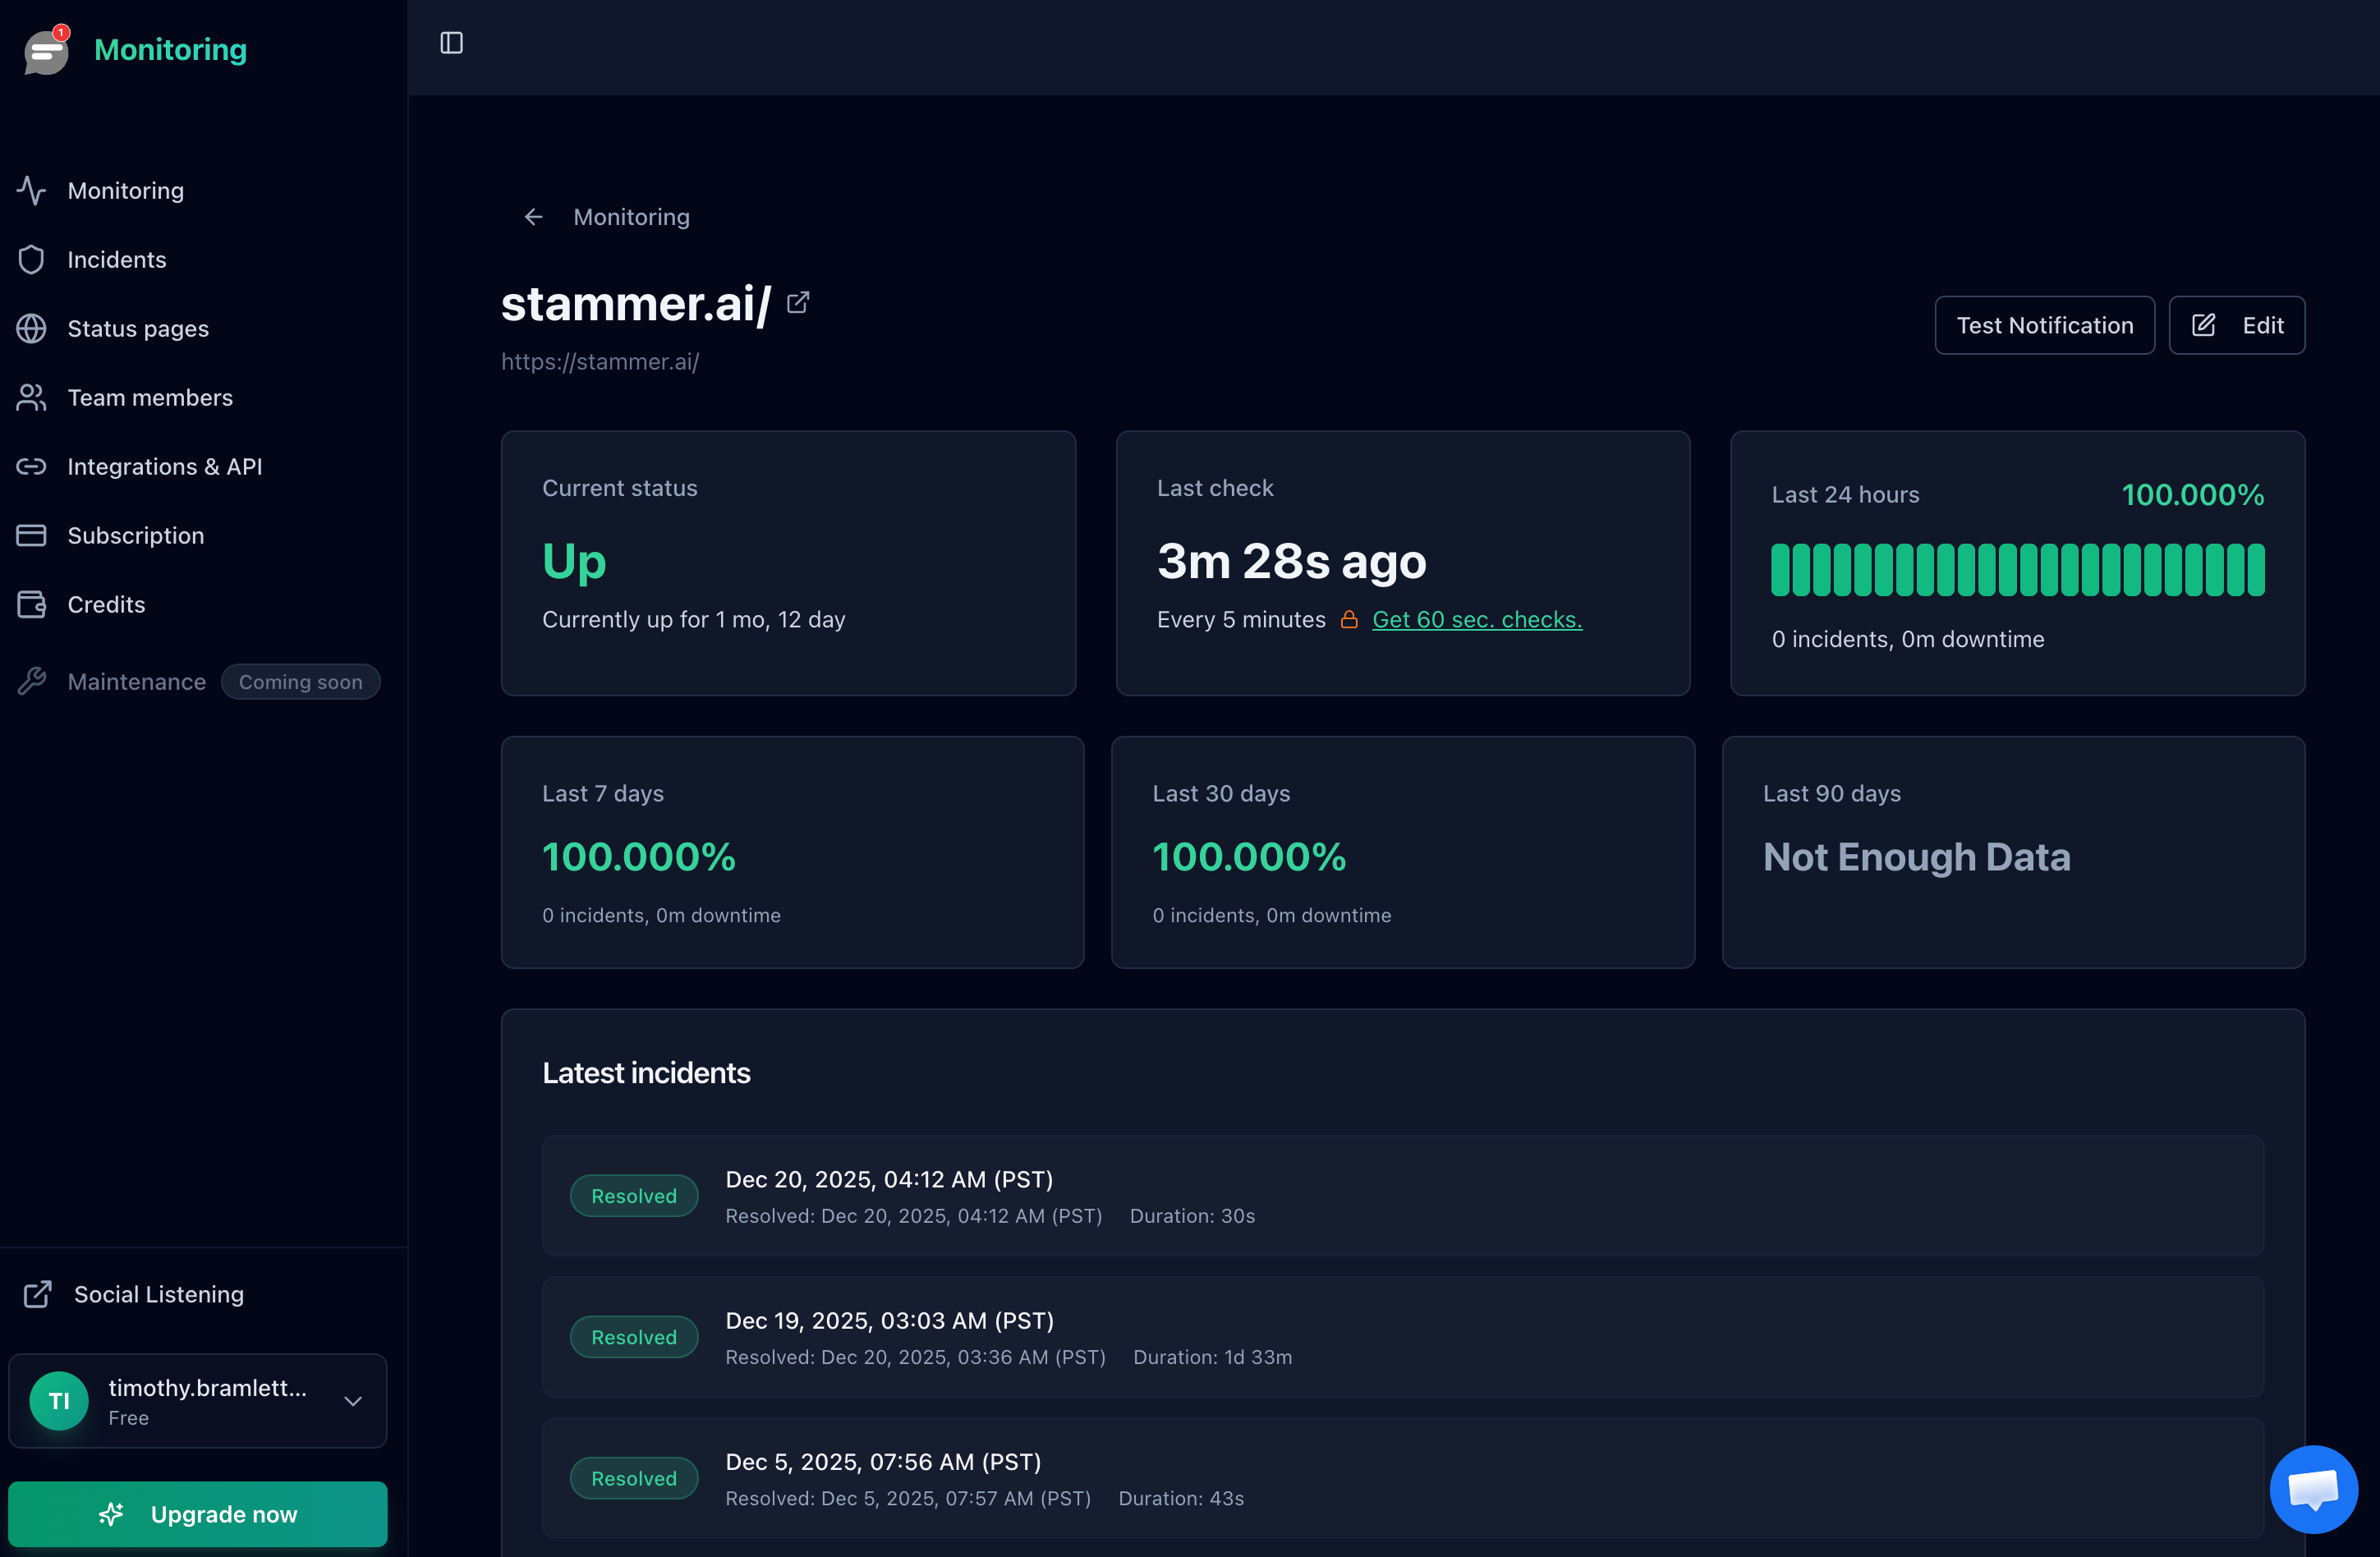
Response time history matters here too. The memory pressure that ends in an OOM kill shows up as a slow upward drift in response times for days beforehand, which is an early warning if anyone is looking at it. Our guide on monitoring website response time covers reading that trend.
How Quickly Each Tool Would Have Told You
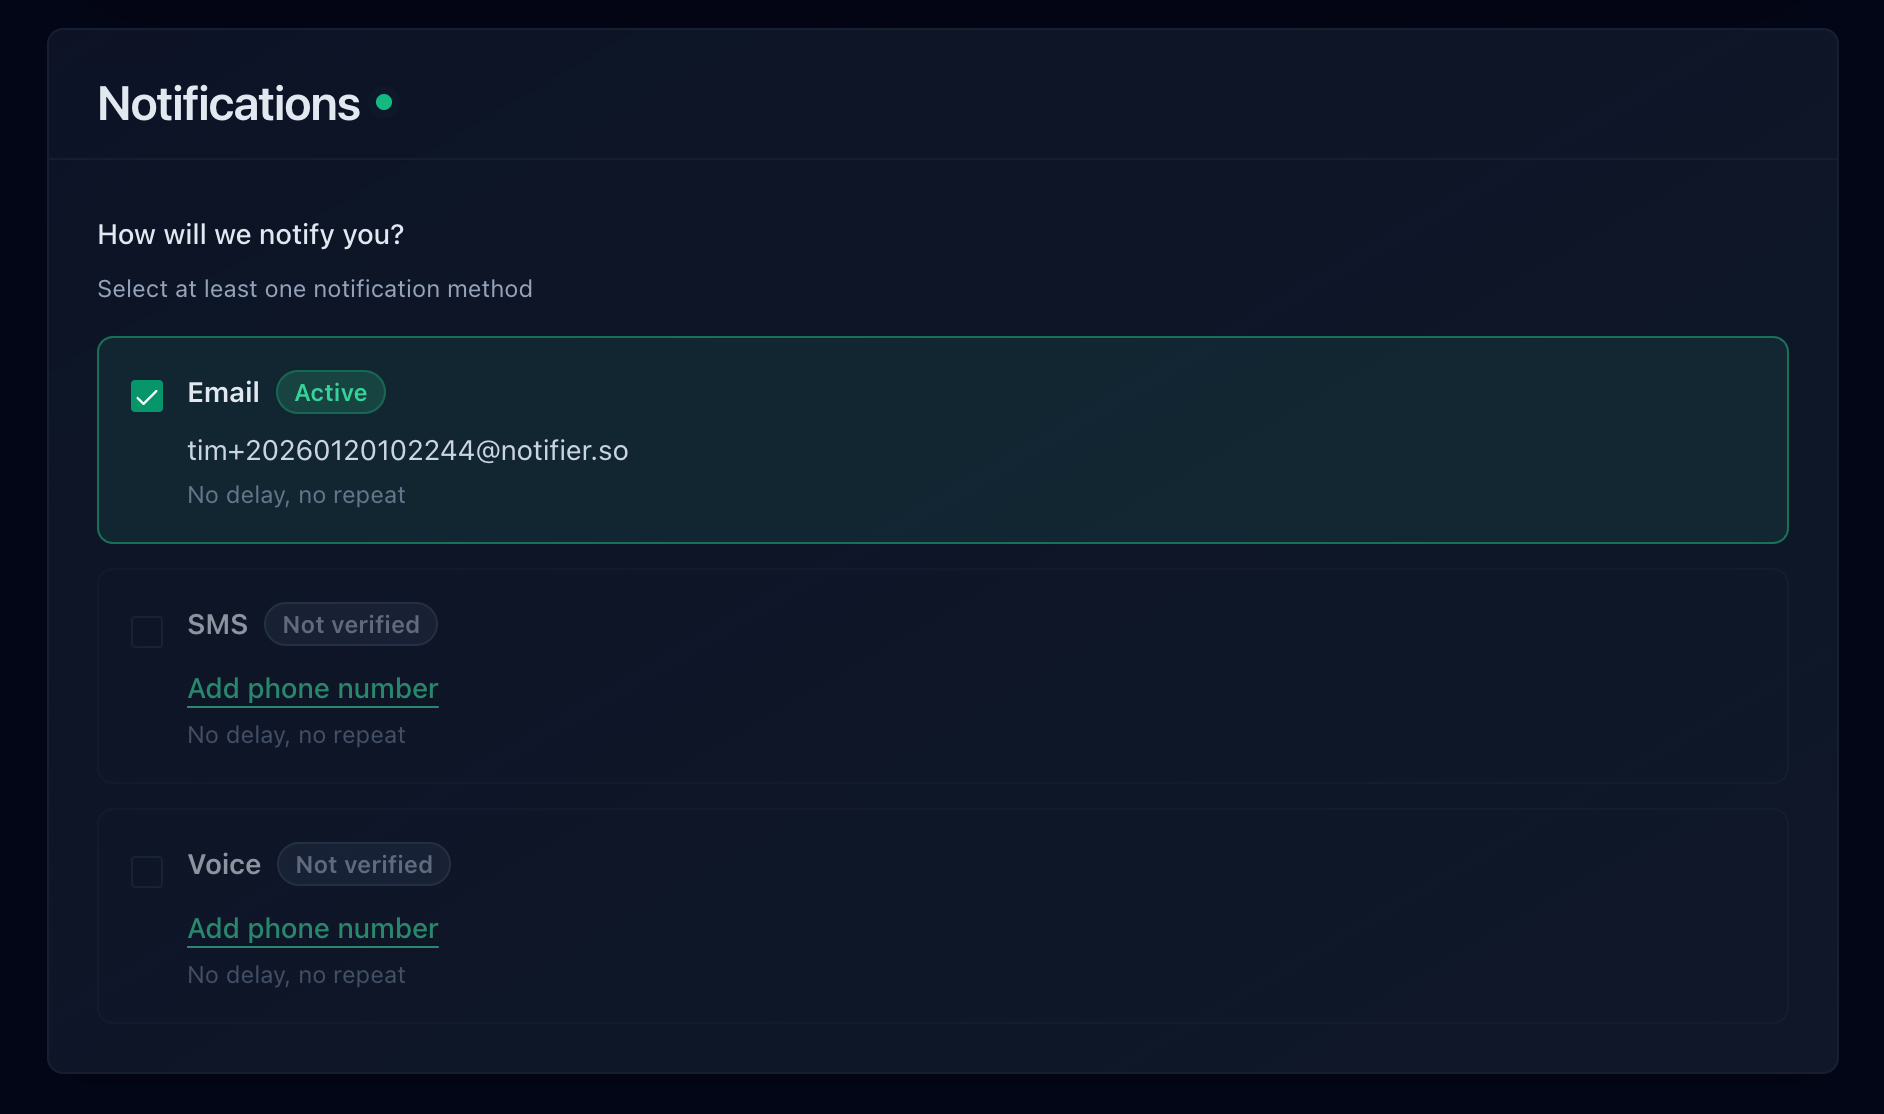
Check interval is the number that matters, because it sets your worst case detection delay, and for an intermittent error it also sets how likely you are to catch a failure at all. Here is how the common options compare on their free plans:
| Tool | Free Plan | Alert Channels on Free | Notes |
|---|---|---|---|
| Notifier | 10 monitors, 5 min checks, 5 status pages | Email, SMS, phone, Slack | SSL and DNS monitoring included on every plan. Free tier is fine for commercial use. Solo is $4/month for 20 monitors at 1 minute. |
| UptimeRobot | 50 monitors, 5 min checks, 1 status page | Free plan is non-commercial only. SMS and voice run on one-time credit bundles. Paid plans start at $8/month for 10 monitors. | |
| Better Stack | 10 monitors, 3 min checks, 1 status page | Email, Slack | Capable incident management, but pricing is per responder at $34/month and climbs quickly for a team. |
| StatusCake | 10 monitors, 5 min checks | Only 1 SSL monitor on free, and status pages are sold separately. The first paid tier is $24.49/month. | |
| Uptime Kuma | Unlimited, self-hosted | Many, via integrations | Free and flexible, but you host it, and a server short on memory can OOM the monitor along with the site it is watching. |
Important: UptimeRobot restricted its free plan to non-commercial use only in October 2024. If the site behind Cloudflare belongs to a business or a client, that free tier is not an option. Notifier's free tier has no such restriction.
Pricing changes, so verify before you commit. Our comparison of free website monitoring tools goes through each free tier in detail, how to set up website monitoring walks through the whole setup, and the website monitoring checklist lists everything worth watching beyond uptime.
Frequently Asked Questions
What is the difference between Cloudflare error 520 and a 502 bad gateway?
A 502 is generated by your own web server when the application behind it failed, and Cloudflare passes it through unchanged because it is a valid HTTP response. A 520 is generated by Cloudflare itself when the server it connected to did not return parseable HTTP at all. The practical consequence is where you look: a 502 sends you to your application logs, while a 520 sends you to the outermost server layer, the kernel log, and your response headers.
Why is my 520 error intermittent?
Intermittency almost always means the failure depends on which connection or which worker handled the request. The two dominant causes are a keepalive race, where your origin closes an idle pooled connection at the moment Cloudflare reuses it, and processes being killed under memory pressure, which only happens when you are busy. Run fifty requests in a loop and record the timestamps, then compare those timestamps against dmesg output for OOM kills and against your traffic graph.
Can I fix a Cloudflare 520 error as a visitor?
No. Clearing your cache, flushing DNS, changing resolvers, restarting your router, and disabling your VPN cannot help, because none of your local state was involved in the failure. Cloudflare reached the site's server successfully and could not parse what came back. Reloading after a minute genuinely works fairly often, since many 520s are intermittent. If you need the site, contact the owner and include the Ray ID printed at the bottom of the error page.
Do large cookies really cause 520 errors?
Yes, and it is one of the most common causes of a 520 that reproduces perfectly on one route. Cloudflare caps response headers at roughly 32 KB in total with a limit near 16 KB for a single header line. Accumulated session, analytics, consent, and A/B testing cookies get there faster than people expect, especially on cart and account pages. Measure with curl -sSI https://example.com/ | wc -c, then remove cookies nothing reads and move large payloads such as JWTs to server side storage.
Does pausing Cloudflare or grey-clouding the record fix a 520?
It is a diagnostic, not a fix. If the error stops with Cloudflare out of the path, you have learned that your origin only misbehaves toward Cloudflare, which points at header size or keepalive settings. The cost is real though: an unproxied record publishes your origin IP address in public DNS permanently, since passive DNS services archive it. Test with a temporary subdomain rather than your main record, and consider a Cloudflare Tunnel as the durable version of the same idea.
Why do I only get 520 errors on one page or one API endpoint?
A route specific 520 is nearly always deterministic rather than load related, which narrows it to two causes. Either that route emits far more response headers than the rest of the site, which is typical of login, cart, checkout, and authenticated API endpoints, or that route triggers a crash or a security rule the others do not. Compare header size between a working page and the failing one, and check the ModSecurity audit log for a rule firing at the same timestamp.
Will uptime monitoring catch a Cloudflare 520 error?
Yes. Cloudflare returns a real HTTP 520 status code rather than a 200 containing an error page, so any monitor validating status codes flags it on the next check. Notifier alerts by email, SMS, phone call, or Slack within a minute on a paid plan and within five minutes on the free tier. Because 520s are often intermittent, a shorter check interval matters more here than for other errors, and monitoring your cart and checkout paths rather than only the homepage matters most of all.