At a Glance
- •413 Request Entity Too Large (renamed Content Too Large in RFC 9110) means your upload or request body exceeded a size limit configured somewhere between the browser and your application. The file is fine and the server is healthy: one number in one config file is too small.
- •On Nginx, the most common cause by far, the setting is client_max_body_size and the default is only 1 MB, which a single phone photo exceeds. Raise it in the http block of nginx.conf, then run nginx -t and reload. Setting it only in the port 80 server block is the usual reason the fix appears not to work.
- •Every layer enforces its own limit independently and the smallest one wins: Cloudflare (100 MB on Free and Pro), Nginx (1 MB), ModSecurity (128 KB for form fields with no file), PHP (2 MB upload_max_filesize, 8 MB post_max_size), and your framework. Raising a layer that was never the bottleneck changes nothing.
- •PHP never returns a 413. When post_max_size is exceeded it discards the body and hands your script an empty $_POST and $_FILES, so you get a blank form or a vague WordPress "HTTP error" instead of an error page. A real 413 page means Nginx, Apache, or a CDN rejected it before PHP ran.
- •Past roughly 100 MB, stop raising limits and upload directly to object storage with a presigned URL. Monitors are read only and never upload files, so assert your limit with curl in your deploy script. Notifier is free for 10 monitors with SSL and DNS monitoring included, and paid plans start at $4/month for 1-minute checks.
413 Request Entity Too Large is the error you get when something you sent was bigger than a number in a configuration file. A photo, a video, a PDF, a CSV import, a long form, a JSON payload. The file is not corrupt, the server is not down, and nothing is broken in the way that word normally implies. A limit was reached, and the server stopped reading.
What makes this error frustrating is not the fix, which is usually one line. It is that there are five or six places that limit could live, they all default to different values, and raising the wrong one produces no change at all. People spend an afternoon editing PHP settings when the limit was in Nginx, or restart their app after changing Nginx when the limit was at Cloudflare. The whole job is finding which layer said no.
This guide covers what a 413 actually means, how to identify the exact layer that rejected the upload in about two minutes, every common limit with its default value and how to change it, why PHP never returns a 413 and what it does instead, why a big upload sometimes fails with a connection reset rather than an error page, and the architecture that removes the problem permanently for large files. If you do not run the site, skip to the visitor section.
What 413 Request Entity Too Large Actually Means
A 413 says the request body exceeded what the server is willing to accept, so it refused to process it. RFC 9110 renamed the status to Content Too Large, and you will also see it called Payload Too Large, but Nginx and Apache still print the original wording, which is why that is the phrase everybody searches for. All three names describe the same thing.
The important property is that a 413 is a deliberate decision, not a failure. DNS resolved, the connection opened, TLS negotiated, the request line and headers were read and understood, and the URL was recognised. Something then compared a byte count against a configured maximum and rejected it on purpose. That is a much better position to debug from than a 502 or a 500, because there is a specific number responsible and it is written down somewhere.
The one idea that fixes most 413s:
A request passes through several layers on the way to your code, and every layer enforces its own limit independently. A typical upload crosses Cloudflare, then Nginx, then PHP or your application server, then your framework's body parser. Each has a different default, ranging from 128 KB to 100 MB. The smallest one wins, and it is the only one that matters. Raising a limit that was never the bottleneck changes nothing, which is why so many people conclude that "the fix did not work" when in fact they fixed a layer that was already fine.
One more property worth knowing before you start: a 413 is not transient. Retrying the identical upload produces the identical response forever, which is the opposite of a 429 where waiting is the whole fix. If an integration is stuck in a retry loop against an endpoint returning 413, it will stay stuck until either the file gets smaller or the limit gets bigger.
413 Compared to the Errors It Gets Confused With
Several different failures look like "my upload did not work." These are the ones worth telling apart before you change any configuration:
| Response | What Was Too Big | Usual Source |
|---|---|---|
| 413 | The request body: a file, a form, a JSON payload | Nginx, Apache, a CDN, or a body parser |
| 414 URI Too Long | The URL itself | A GET form with many fields, or a runaway query string |
| 431 Request Header Fields Too Large | The headers, almost always cookies | Rare in practice, because most servers send 400 instead |
| 400 Bad Request | Usually the headers, sometimes nothing | Oversized cookies on Nginx and IIS, or a framework limit |
| 404.13 on IIS | The request body | IIS request filtering, the IIS spelling of a 413 |
| 504 Gateway Timeout | Nothing, the upload just took too long | A slow connection sending a large but permitted file |
| Connection reset mid upload | The request body, probably | A server that closed the socket rather than finish reading, see below |
| 200 with nothing saved | The request body | PHP exceeding post_max_size, the most misleading case of all |
PHP does not send a 413. When an upload exceeds post_max_size, PHP discards the entire request body and hands your script a completely empty $_POST and $_FILES, then returns whatever your code decides to return, usually a 200. So a real 413 page means the limit was hit by a web server or a CDN in front of PHP, while a vague "HTTP error" in the WordPress media library, a form that submits and silently saves nothing, or a page that reloads blank all point at PHP instead. That single distinction saves hours.
If You Hit This on Someone Else's Site
Unlike most HTTP errors, this one you can often work around yourself, because the thing that is too big is a file on your own computer. The site's limit is not going to move today, so the file has to.
- Check whether the site tells you the limit. Upload forms usually state a maximum somewhere near the file picker, and WordPress prints "Maximum upload file size" directly under it. If your file is over that number, nothing else in this list matters. Get under it.
- Resize the image rather than compressing it. A photo straight off a phone is often 12 megapixels and 6 MB. Exporting it at 2000 pixels wide takes it under 1 MB with no visible difference on a web page. This one change solves the majority of upload failures.
- Compress the PDF. Scanned documents are enormous because every page is a full resolution image. Most PDF tools have a "reduce file size" or "export for web" option that typically cuts it by 80 percent or more.
- Upload files one at a time. Some limits apply to the whole request, not to each file, so five 3 MB images in one submission can be rejected while each one on its own is accepted.
- Do not zip it. A zip of a JPEG, an MP4, or a PDF saves almost nothing, because those formats are already compressed. It only helps for text, spreadsheets, or folders of documents. Many sites also reject zip files outright.
- Send a link instead. For anything genuinely large, such as video, upload it to a file sharing service or cloud drive and paste the link into the form. This is what the site owner would have told you to do anyway.
- Report it if the file is clearly reasonable. If a 900 KB image is being refused, the site has a misconfiguration and only the owner can fix it. Tell them the page, the file size, and the time.
What will not help: clearing your cache, restarting your router, flushing DNS, switching browsers, or using a VPN. A 413 proves the connection worked perfectly and your request arrived intact. Your upload speed is not the problem either. The server counted the bytes and decided there were too many, and no amount of local troubleshooting changes that count.
Find the Limit, Then Find the Layer
Two questions answer almost everything: at what size does it start failing, and who sent the rejection? Both are quick to answer from a terminal.
Step 1: Binary Search the Threshold
Generate test files of increasing size and post each one to the endpoint that is failing. The size where the status code changes tells you which layer you are hitting before you read a single config file:
for MB in 1 2 5 10 20 50; do
  head -c ${MB}M /dev/urandom > /tmp/probe.bin
  CODE=$(curl -s -o /dev/null -w "%{http_code}" \
    -F "file=@/tmp/probe.bin" https://example.com/upload)
  echo "${MB} MB -> ${CODE}"
done
Typical output on a default Nginx install:
1 MB -> 413
2 MB -> 413
5 MB -> 413
10 MB -> 413
20 MB -> 413
50 MB -> 413
Everything failing including 1 MB points at the Nginx default of exactly 1 MB, since multipart encoding adds a little overhead and pushes a 1 MB file just over it. A cutoff at 2 MB points at PHP's upload_max_filesize. At 8 MB, PHP's post_max_size. At 100 MB, Cloudflare on a Free or Pro plan. Around 128 KB for form fields with no file attached, ModSecurity. The number is a fingerprint.
On macOS:
head -c 5M is a GNU coreutils feature and will not work. Use mkfile 5m /tmp/probe.bin or dd if=/dev/zero of=/tmp/probe.bin bs=1m count=5 instead. Everything else in the loop is the same.
Step 2: Work Out Which Layer Answered
Send one oversized request and read the whole response, headers and body together:
curl -s -D - -F "file=@/tmp/probe.bin" https://example.com/uploadMatch what comes back against this table:
| What You See | Who Rejected It | Go To |
|---|---|---|
| Plain page ending in a centred "nginx" line | Nginx, directly | Cause 1 |
| "Request Entity Too Large" with an Apache server header | Apache LimitRequestBody | Cause 2 |
| 403 or 413 and the error log mentions a body limit | ModSecurity or a WAF rule | Cause 2 |
| 200, but the record was never created | PHP post_max_size, body discarded | Cause 3 |
| JSON body saying "request entity too large" | Express, or another framework body parser | Cause 4 |
| An IIS page naming error 404.13 | IIS request filtering | Cause 4 |
| A branded error page and a cf-ray header | Cloudflare plan limit | Cause 5 |
Step 3: Read the Log Line That Names the Number
Both Nginx and Apache write an error log entry that states the size received and the limit that was applied. This is the most direct evidence available and it removes all guesswork:
# Nginx
grep "too large body" /var/log/nginx/error.log | tail -20

# Apache
grep -i "larger than the configured limit" /var/log/apache2/error.log | tail -20
An Nginx line looks like this, and the byte count is the size the client tried to send:
2026/09/22 11:04:18 [error] 1841#1841: *5729 client intended to send too large body:
6291702 bytes, client: 203.0.113.44, server: example.com,
request: "POST /wp-admin/async-upload.php HTTP/2.0", host: "example.com"
Apache names both numbers outright: Requested content-length of 15728640 is larger than the configured limit of 10485760. If neither log contains anything at the time of the failure, the rejection happened upstream at a CDN or load balancer and never reached your server at all.
Count Them in Your Access Log
If you are trying to work out how long this has been happening and to whom, the access log answers both. With the default combined log format, field 9 is the status code and field 7 is the path:
# Which endpoints are returning 413
awk '$9 == 413 {print $7}' /var/log/nginx/access.log | sort | uniq -c | sort -rn | head -20

# When it started, by hour, to line up against a deploy
awk '$9 == 413 {print substr($4, 2, 14)}' /var/log/nginx/access.log | uniq -c

# How many distinct people are affected
awk '$9 == 413 {print $1}' /var/log/nginx/access.log | sort -u | wc -l
One IP means a single customer with one enormous file. Dozens of distinct IPs across many paths means a limit changed, usually because a server was rebuilt, a proxy was added in front, or a configuration management tool reset a file. That distinction decides whether you are handling a support ticket or an incident.
Cause 1: Nginx and client_max_body_size
This is the single most common cause of a 413 on the internet, because the Nginx default is 1 MB and almost nobody expects it to be that low. One phone photo exceeds it. The directive is client_max_body_size, and it can be set in the http, server, or location context.
The Fix
Set it once at the http level in /etc/nginx/nginx.conf so every site inherits it:
http {
    client_max_body_size 64m;
    ...
}
Or scope it to the one path that needs it, which is the better habit because it keeps the rest of your site protected from oversized requests:
server {
    listen 443 ssl;
    server_name example.com;

    client_max_body_size 2m;

    location /api/uploads/ {
        client_max_body_size 200m;
        proxy_pass http://app_backend;
    }
}
Then test the configuration and reload. Editing the file is not enough, and this is where a real fix most often appears to fail:
sudo nginx -t && sudo systemctl reload nginxWhy Your Change Did Not Take Effect
Four reasons account for nearly all of the cases where the directive is set correctly and the 413 continues:
- You set it in the port 80 server block only. Sites commonly have two server blocks, one redirecting HTTP to HTTPS and one doing the real work on 443. The upload happens over HTTPS, so a value set only in the first block is never consulted. Put it in
httpto cover both. - A location block overrides it. The most specific matching context wins, so an
httplevel 64m is ignored inside a location that sets 1m. Print the fully resolved configuration and look at every occurrence:nginx -T | grep -n client_max_body_size. - Nginx was not reloaded. Or it was reloaded but a control panel such as Plesk, cPanel, or a Kubernetes ingress controller regenerates the file from a template and overwrote your edit on the next deploy. Check the file again after reloading.
- There is a second Nginx. A load balancer in front of the application server is a very common setup, and both instances enforce the limit. Raise it on both.
Do not use client_max_body_size 0;. It disables the check entirely, which is a genuine availability risk rather than a theoretical one. Anyone can then stream an unbounded request at your server, filling disk with temporary body files or exhausting memory. Set a real number with headroom above your largest legitimate upload. If you cannot name that number, the answer is almost certainly that the file should be going to object storage instead, which is covered in the prevention section.
Kubernetes and Ingress
If you run on Kubernetes with the ingress-nginx controller, the limit is set with an annotation on the Ingress resource rather than in a config file, and the default is again 1 MB:
metadata:
  annotations:
    nginx.ingress.kubernetes.io/proxy-body-size: "64m"
When the Browser Shows a Connection Reset Instead
Sometimes a large upload does not produce a 413 page at all. The progress bar climbs, then the browser reports ERR_CONNECTION_RESET or simply "network error." This is the same problem wearing a disguise. Nginx decides to reject as soon as it reads a Content-Length over the limit, sends the 413, and closes the connection, but the browser is still busy sending the body and never reads the response before the socket dies. The error you see is the socket closing, not the rejection.
The tell is that your Nginx error log contains the "too large body" line while the browser shows a network error rather than an HTTP status. Fix the limit and both symptoms go away together. Testing with curl instead of a browser also exposes the real status code, because curl reads the response properly.
Cause 2: Apache and ModSecurity
Apache's own limit is LimitRequestBody, measured in bytes, and the default in a stock build is 0, meaning unlimited. That makes Apache itself an uncommon cause on a server you configured yourself. It becomes a very common cause on shared hosting, where the host sets a low value globally, and on cPanel or Plesk servers where a panel setting writes it into your virtual host.
# Find where it is already set
grep -ri "LimitRequestBody" /etc/apache2/ /etc/httpd/ 2>/dev/null

# Set it in a virtual host, a Directory block, or .htaccess
# 64 MB expressed in bytes
LimitRequestBody 67108864
It is accepted in .htaccess when AllowOverride permits it, which is how most shared hosting customers raise it without server access. Reload Apache after changing a server level file with sudo systemctl reload apache2. Changes in .htaccess take effect immediately.
The ModSecurity Limit Nobody Expects
If your host runs ModSecurity, and most managed hosts do, there is a second pair of limits that operate before your application sees anything. The one that causes real confusion is SecRequestBodyNoFilesLimit, which defaults to 131072 bytes, or 128 KB, and applies to request bodies that are not file uploads.
That is why a long blog post, a large block of pasted JSON, a page builder layout, or a bulk edit form can fail while a 20 MB image uploads perfectly. It looks irrational until you know the two limits are separate:
# modsecurity.conf
SecRequestBodyLimit 134217728          # 128 MB, total body including files
SecRequestBodyNoFilesLimit 1048576     # 1 MB, body excluding files
Raise SecRequestBodyNoFilesLimit to something sane like 1 MB rather than to the same value as the file limit, since keeping it modest is a real protection against payload based attacks. The giveaway in the log is a line reading Request body no files data length is larger than the configured limit. Note that ModSecurity may return 403 rather than 413 depending on SecRequestBodyLimitAction, so a 403 on a large form submission is worth checking here too.
Cause 3: PHP Limits and the WordPress Media Library
PHP has its own limits, they are low by default, and as established above they do not produce a 413. They produce a truncated request, an empty form, or a WordPress upload that fails with an unhelpful message. These are the values that matter:
| Setting | Default | What It Governs |
|---|---|---|
| upload_max_filesize | 2M | The largest single uploaded file |
| post_max_size | 8M | The whole POST body, files and fields together |
| memory_limit | 128M | Memory per request, which image processing consumes quickly |
| max_file_uploads | 20 | How many files one request may contain |
| max_execution_time | 30 | Seconds of processing, which matters for large media |
The rule that trips people up is that post_max_size must be larger than upload_max_filesize, with a margin. A multipart request contains the file plus boundaries, field names, and any other form data, so a 64 MB file arrives as slightly more than 64 MB of body. Setting both to the same number causes intermittent failures on exactly the files that should have worked.
Where to Actually Set Them
First find the file PHP is really reading, because most servers have several and only one is live:
php -i | grep "Loaded Configuration File"
php -i | grep -E "upload_max_filesize|post_max_size|memory_limit"
Be aware that the CLI and the web server often use different ini files. The authoritative check for a website is a one line script containing <?php phpinfo(); loaded in a browser and deleted immediately afterwards. WordPress users can read the same values under Tools, then Site Health, then Info, then Server, with nothing to clean up.
# php.ini, the usual place
upload_max_filesize = 64M
post_max_size = 65M
memory_limit = 256M
max_execution_time = 300

# PHP-FPM pool file, which overrides php.ini for that pool
php_admin_value[upload_max_filesize] = 64M
php_admin_value[post_max_size] = 65M

# .user.ini in the site root, for shared hosting without ini access
upload_max_filesize = 64M
post_max_size = 65M
Restart the PHP handler after changing php.ini or a pool file, with something like sudo systemctl restart php8.3-fpm. Reloading Nginx alone does nothing here, because Nginx does not read PHP settings. A .user.ini file is cached and can take up to five minutes to apply.
Two fixes that are widely recommended and silently do nothing. Putting php_value upload_max_filesize 64M in .htaccess only works with mod_php, so on the PHP-FPM setup that nearly every modern host uses it is ignored, and on some configurations it produces a 500 instead. Putting @ini_set('upload_max_filesize', '64M') in wp-config.php never works, because that directive can only be changed before the request is parsed, not from inside a running script. Neither produces an error message, which is why both keep getting recommended.
WordPress Specifics
WordPress prints the effective limit under the file picker in Media, then Add New, as "Maximum upload file size." If that number does not change after you edit PHP settings, the settings are not being applied and there is no point editing them further. Go back and confirm which ini file is loaded.
Two WordPress specific traps are worth knowing. On multisite, there is an additional limit in Network Admin, then Settings, then "Max upload file size," which defaults to 1500 KB and silently caps everything regardless of your PHP configuration. And the generic "HTTP error" message in the media uploader is not a 413 at all in most cases: it usually means the image library ran out of memory while generating thumbnails, so raise memory_limit rather than the upload limits. For the wider set of things that break WordPress sites, our WordPress uptime monitoring guide covers the failure patterns that actually take sites down.
Cause 4: Your Framework's Body Parser
If the web server and the CDN both pass the request through, your application framework gets the last word, and most frameworks ship with a conservative default that exists to stop a single request from exhausting memory. These are the limits that produce a 413 from a server you thought you had already fixed:
| Platform | Setting and Default | Status It Returns |
|---|---|---|
| Express and Node | express.json body limit, 100 KB | 413 with "request entity too large" |
| Django | DATA_UPLOAD_MAX_MEMORY_SIZE, 2.5 MB | 400, not 413 |
| Spring Boot | max-file-size 1 MB, max-request-size 10 MB | 500 unless the exception is handled |
| Tomcat | maxPostSize, 2 MB | 400 or 413 depending on version |
| ASP.NET Core | MaxRequestBodySize, roughly 28.6 MB | 413 |
| IIS | maxAllowedContentLength, 30000000 bytes | 404.13, its own spelling of 413 |
Express and Node
The 100 KB default catches a surprising number of JSON APIs the first time a client sends a real payload. The string "request entity too large" in a Node stack trace comes from the raw-body package underneath the parser:
app.use(express.json({ limit: '5mb' }));
app.use(express.urlencoded({ limit: '5mb', extended: true }));
Raise it for the routes that need it rather than globally. An endpoint that accepts a 5 MB JSON document is a legitimate design, but making every endpoint accept 5 MB gives an attacker a cheap way to tie up memory.
Django
Django returns a 400 rather than a 413 when the body exceeds DATA_UPLOAD_MAX_MEMORY_SIZE, which is why a Django 413 investigation often ends up in the 400 Bad Request guide instead. Note that file uploads spooled to disk are governed separately, so the setting below mostly affects large form posts rather than files:
# settings.py
DATA_UPLOAD_MAX_MEMORY_SIZE = 10 * 1024 * 1024   # 10 MB
DATA_UPLOAD_MAX_NUMBER_FIELDS = 2000
IIS and ASP.NET
IIS reports this as error 404.13, which sends people hunting for a missing file. There are two separate limits and both usually need raising, one in request filtering and one in ASP.NET itself:
<!-- web.config: IIS request filtering, in bytes -->
<system.webServer>
  <security>
    <requestFiltering>
      <requestLimits maxAllowedContentLength="67108864" />
    </requestFiltering>
  </security>
</system.webServer>

<!-- ASP.NET, in kilobytes -->
<system.web>
  <httpRuntime maxRequestLength="65536" executionTimeout="300" />
</system.web>
The units differ between the two, which catches almost everyone. Request filtering counts bytes, ASP.NET counts kilobytes.
Cause 5: Cloudflare, Load Balancers, and Serverless
If your server logs show nothing at the moment of the failure, the request never reached you. Something in front rejected it, and no amount of server configuration will change that. The most common is Cloudflare, whose maximum upload size is fixed by plan:
| Cloudflare Plan | Maximum Upload Size | Adjustable |
|---|---|---|
| Free | 100 MB | No |
| Pro | 100 MB | No |
| Business | 200 MB | No |
| Enterprise | 500 MB by default | Yes, self serve up to 5 GB |
Verify the plan limit is what you are hitting by testing the origin directly, bypassing Cloudflare entirely. If the upload succeeds against the origin IP and fails through the proxy, the limit is Cloudflare's:
curl -s -o /dev/null -w "%{http_code}\n" \
  --resolve example.com:443:203.0.113.10 \
  -F "file=@/tmp/probe.bin" https://example.com/upload
The common workaround has a permanent cost. The usual advice is to move large uploads to a subdomain such as upload.example.com set to DNS only, the grey cloud, so traffic bypasses the proxy and the plan limit. That works, but it also publishes your origin IP address forever in passive DNS records, and once it is out there it cannot be recalled. Every DDoS protection and WAF benefit you get from Cloudflare depends on that address staying private. Prefer uploading directly to object storage, covered below, and treat the grey cloud subdomain as a last resort behind a firewall that only accepts Cloudflare ranges.
Serverless and Managed Platforms
Serverless platforms have hard limits you cannot configure at any price, so if you are near them, the architecture has to change rather than a setting:
- AWS API Gateway: 10 MB maximum payload for REST and HTTP APIs. Not adjustable.
- AWS Lambda: 6 MB for a synchronous invocation payload, which is smaller than the API Gateway limit and therefore usually the real ceiling.
- Cloudflare Workers: bounded by the zone's upload limit above, with the same per plan values.
- Vercel and Netlify functions: low single digit megabyte request body limits, with uploads expected to go directly to storage.
In every one of these cases the intended pattern is the same: the file never passes through your compute layer at all. That is the subject of the prevention section.
Getting a 413 From an API You Are Calling
When your code is the client rather than the server, a 413 means the API has a documented limit and you exceeded it. Three rules make this a clean failure instead of a mysterious one.
Never retry a 413. Retry logic belongs on 429, 502, 503, and timeouts, where a later attempt can genuinely succeed. A 413 is deterministic, and retrying only burns quota and delays the moment somebody notices. Fail immediately and log the payload size along with the URL, because the size is the one fact that makes the ticket solvable.
Check the size before sending. If the API documents a 10 MB limit, measure the body and refuse it yourself with a clear message. A meaningful error in your own logs beats an opaque one from someone else's infrastructure, and you avoid pushing megabytes across the network only to have them discarded.
Batch smaller. Most 413s against third party APIs come from bulk operations that grew, such as a nightly sync that posts every changed record in one request. Split the batch. Chunks of a few hundred records are also easier to retry and easier to reason about when one fails.
If You Are Designing the API
Return a body that names the limit and the size received. This turns an hour of somebody else's debugging into a five second read:
HTTP/1.1 413 Content Too Large
Content-Type: application/json

{"error": "payload_too_large", "max_bytes": 10485760, "received_bytes": 18874368,
 "hint": "Use POST /v1/uploads to request a direct upload URL for files over 10 MB."}
Document the limit in the same place as the endpoint, not in a separate limits page nobody finds. And make sure the limit you document is the real one, which is the smallest across your whole chain rather than the number in your application config. Our guide on monitoring an API endpoint covers verifying that your published behaviour stays true after deploys.
Preventing the Next One
Set the Whole Chain to One Number
Decide the largest upload your site supports, write it down, and set every layer to that number with a little headroom. For a 50 MB target on a typical Nginx and PHP stack:
| Layer | Setting | Value |
|---|---|---|
| CDN | Plan upload limit | Confirm it exceeds 50 MB |
| Nginx | client_max_body_size | 64m |
| Apache | LimitRequestBody | 67108864 |
| ModSecurity | SecRequestBodyLimit | 67108864 |
| PHP | upload_max_filesize | 56M |
| PHP | post_max_size | 60M |
| Application | Validated maximum shown to users | 50 MB |
The number your users see should be the smallest, so that a file over the limit is refused politely by your own form with a clear message instead of being refused rudely by Nginx thirty seconds into an upload. Validate the size in the browser before the upload starts, which costs three lines of JavaScript and prevents the entire experience.
For Anything Large, Skip the Web Server Entirely
Once you are talking about video, large archives, or anything past roughly 100 MB, raising limits is the wrong direction. Every such upload occupies a worker process for its entire duration, consumes disk for temporary files, and multiplies the damage of a traffic spike. The standard answer is a presigned upload URL: your server authorises the upload and the browser sends the file straight to object storage, so it never touches your web server or your CDN limit.
import boto3

s3 = boto3.client('s3')
presigned = s3.generate_presigned_post(
    Bucket='uploads.example.com',
    Key='user-42/recording.mp4',
    Conditions=[['content-length-range', 1, 524288000]],   # 1 byte to 500 MB
    ExpiresIn=600,
)
# Return presigned to the browser and POST the file directly to presigned['url']
The content-length-range condition enforces the size limit at the storage layer, so an oversized file is rejected without ever reaching your infrastructure. Cloudflare R2, Google Cloud Storage, and Azure Blob Storage all offer the same pattern. This is also the only approach that works on serverless platforms with hard payload limits.
Test the Limit on Every Deploy
Upload limits break silently after server rebuilds, container image updates, control panel changes, and the day somebody puts a new proxy in front. A four line check in your deploy script catches all of it:
#!/bin/bash
# Assert that a file at our advertised limit is still accepted
head -c 45M /dev/urandom > /tmp/smoke.bin
CODE=$(curl -s -o /dev/null -w "%{http_code}" \
  -F "file=@/tmp/smoke.bin" https://example.com/api/uploads)

if [ "$CODE" = "413" ]; then
  echo "FAIL: upload limit regressed, 45 MB is being rejected"
  exit 1
fi
echo "Upload limit OK (status $CODE)"
Treat only a 413 as a failure. A 401 or a 422 from the endpoint means the request got through and your validation rejected the content, which is a pass for this particular test.
Be honest about what monitoring can and cannot see here. Uptime monitors send read only requests. They do not upload files, because a monitor posting test files to your forms every minute would fill your storage with junk. That means a broken upload limit is invisible to any uptime check, including Notifier's, and the curl smoke test above is the right tool for it. What monitoring covers is the much larger category of failures that take pages down outright, which is why the two belong together rather than in competition.
Monitor Everything Else Continuously
The same configuration changes that break an upload limit routinely break other things at the same time, and those are very much detectable. A server rebuild that resets client_max_body_size often resets other settings too. Setting up an external check takes a couple of minutes and covers the whole site from outside, the way a visitor sees it.
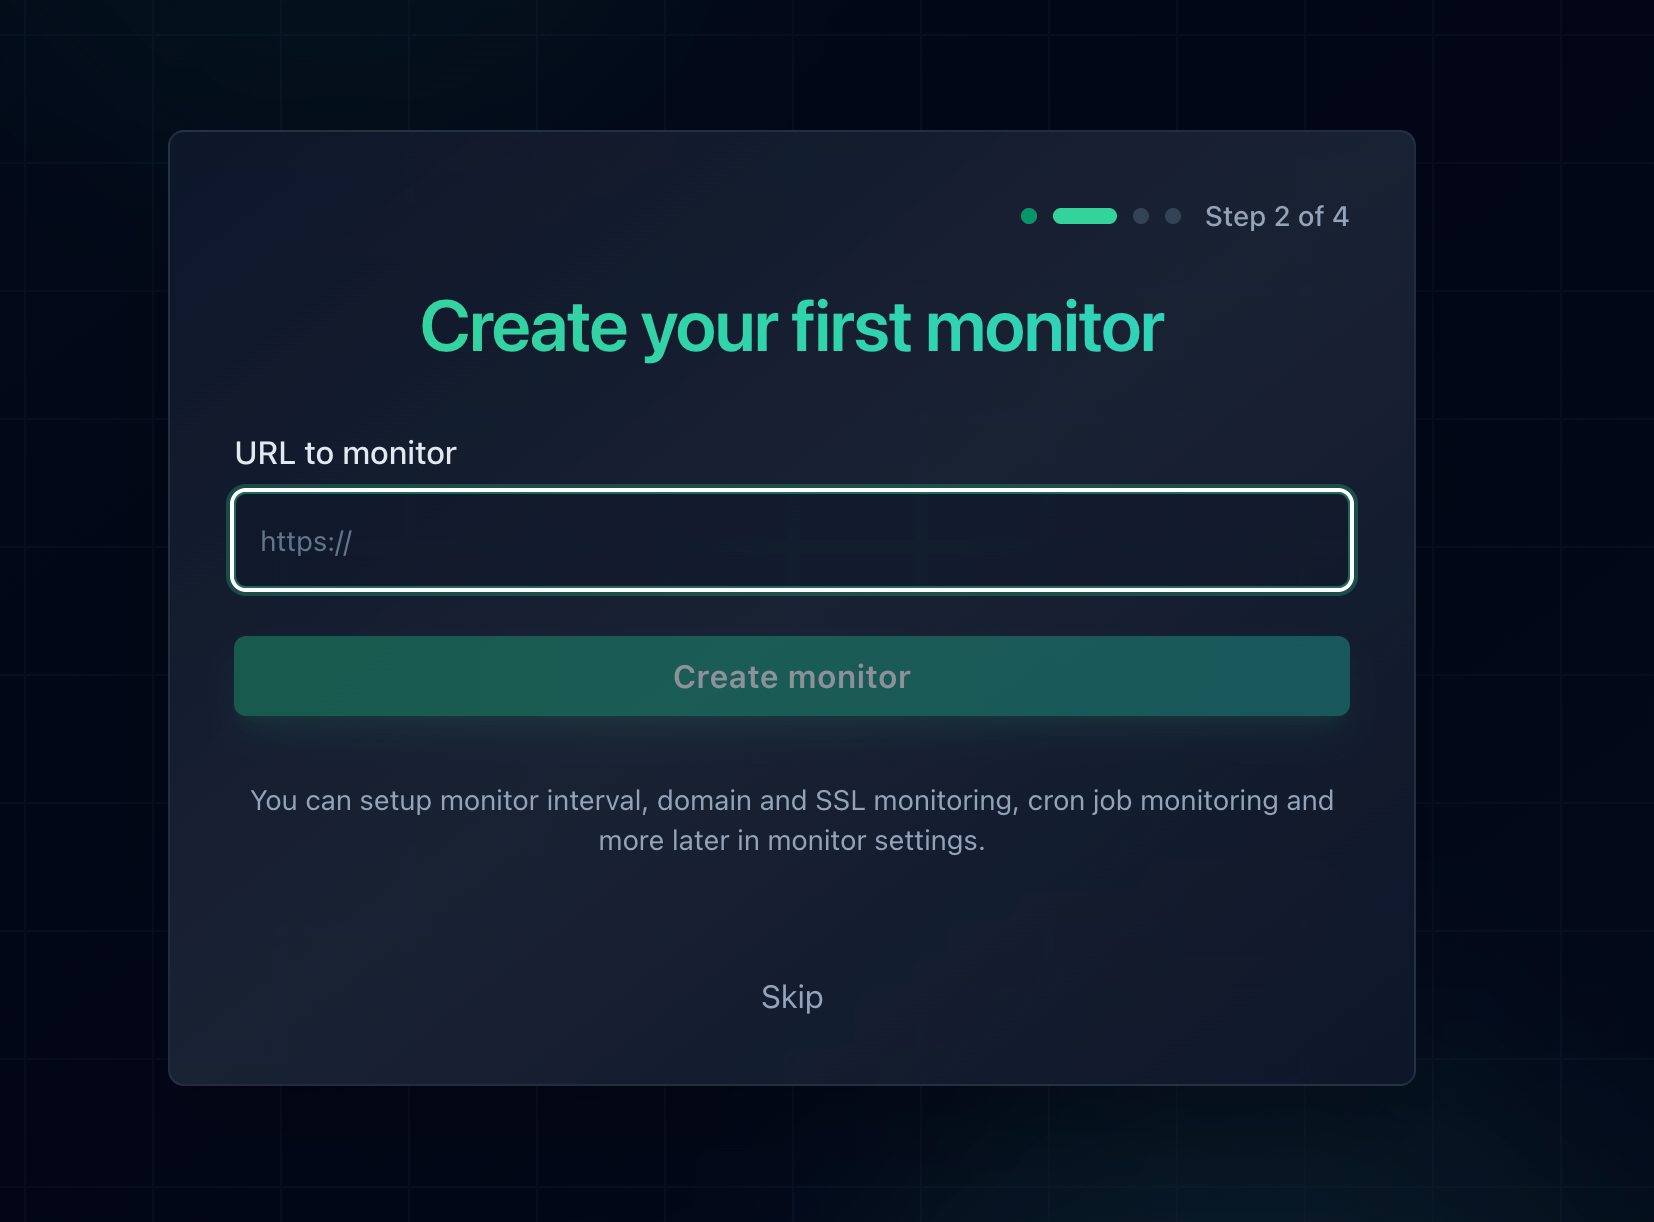
Adding a monitor takes a URL and an alert channel. Do this for every page that matters, not just the homepage.
Monitor the upload page itself, not only the homepage. A page that renders an upload form can break for reasons entirely unrelated to the size limit, and if you only check the homepage you will not hear about it. The same applies to your API base URL and any endpoint a customer integration depends on.
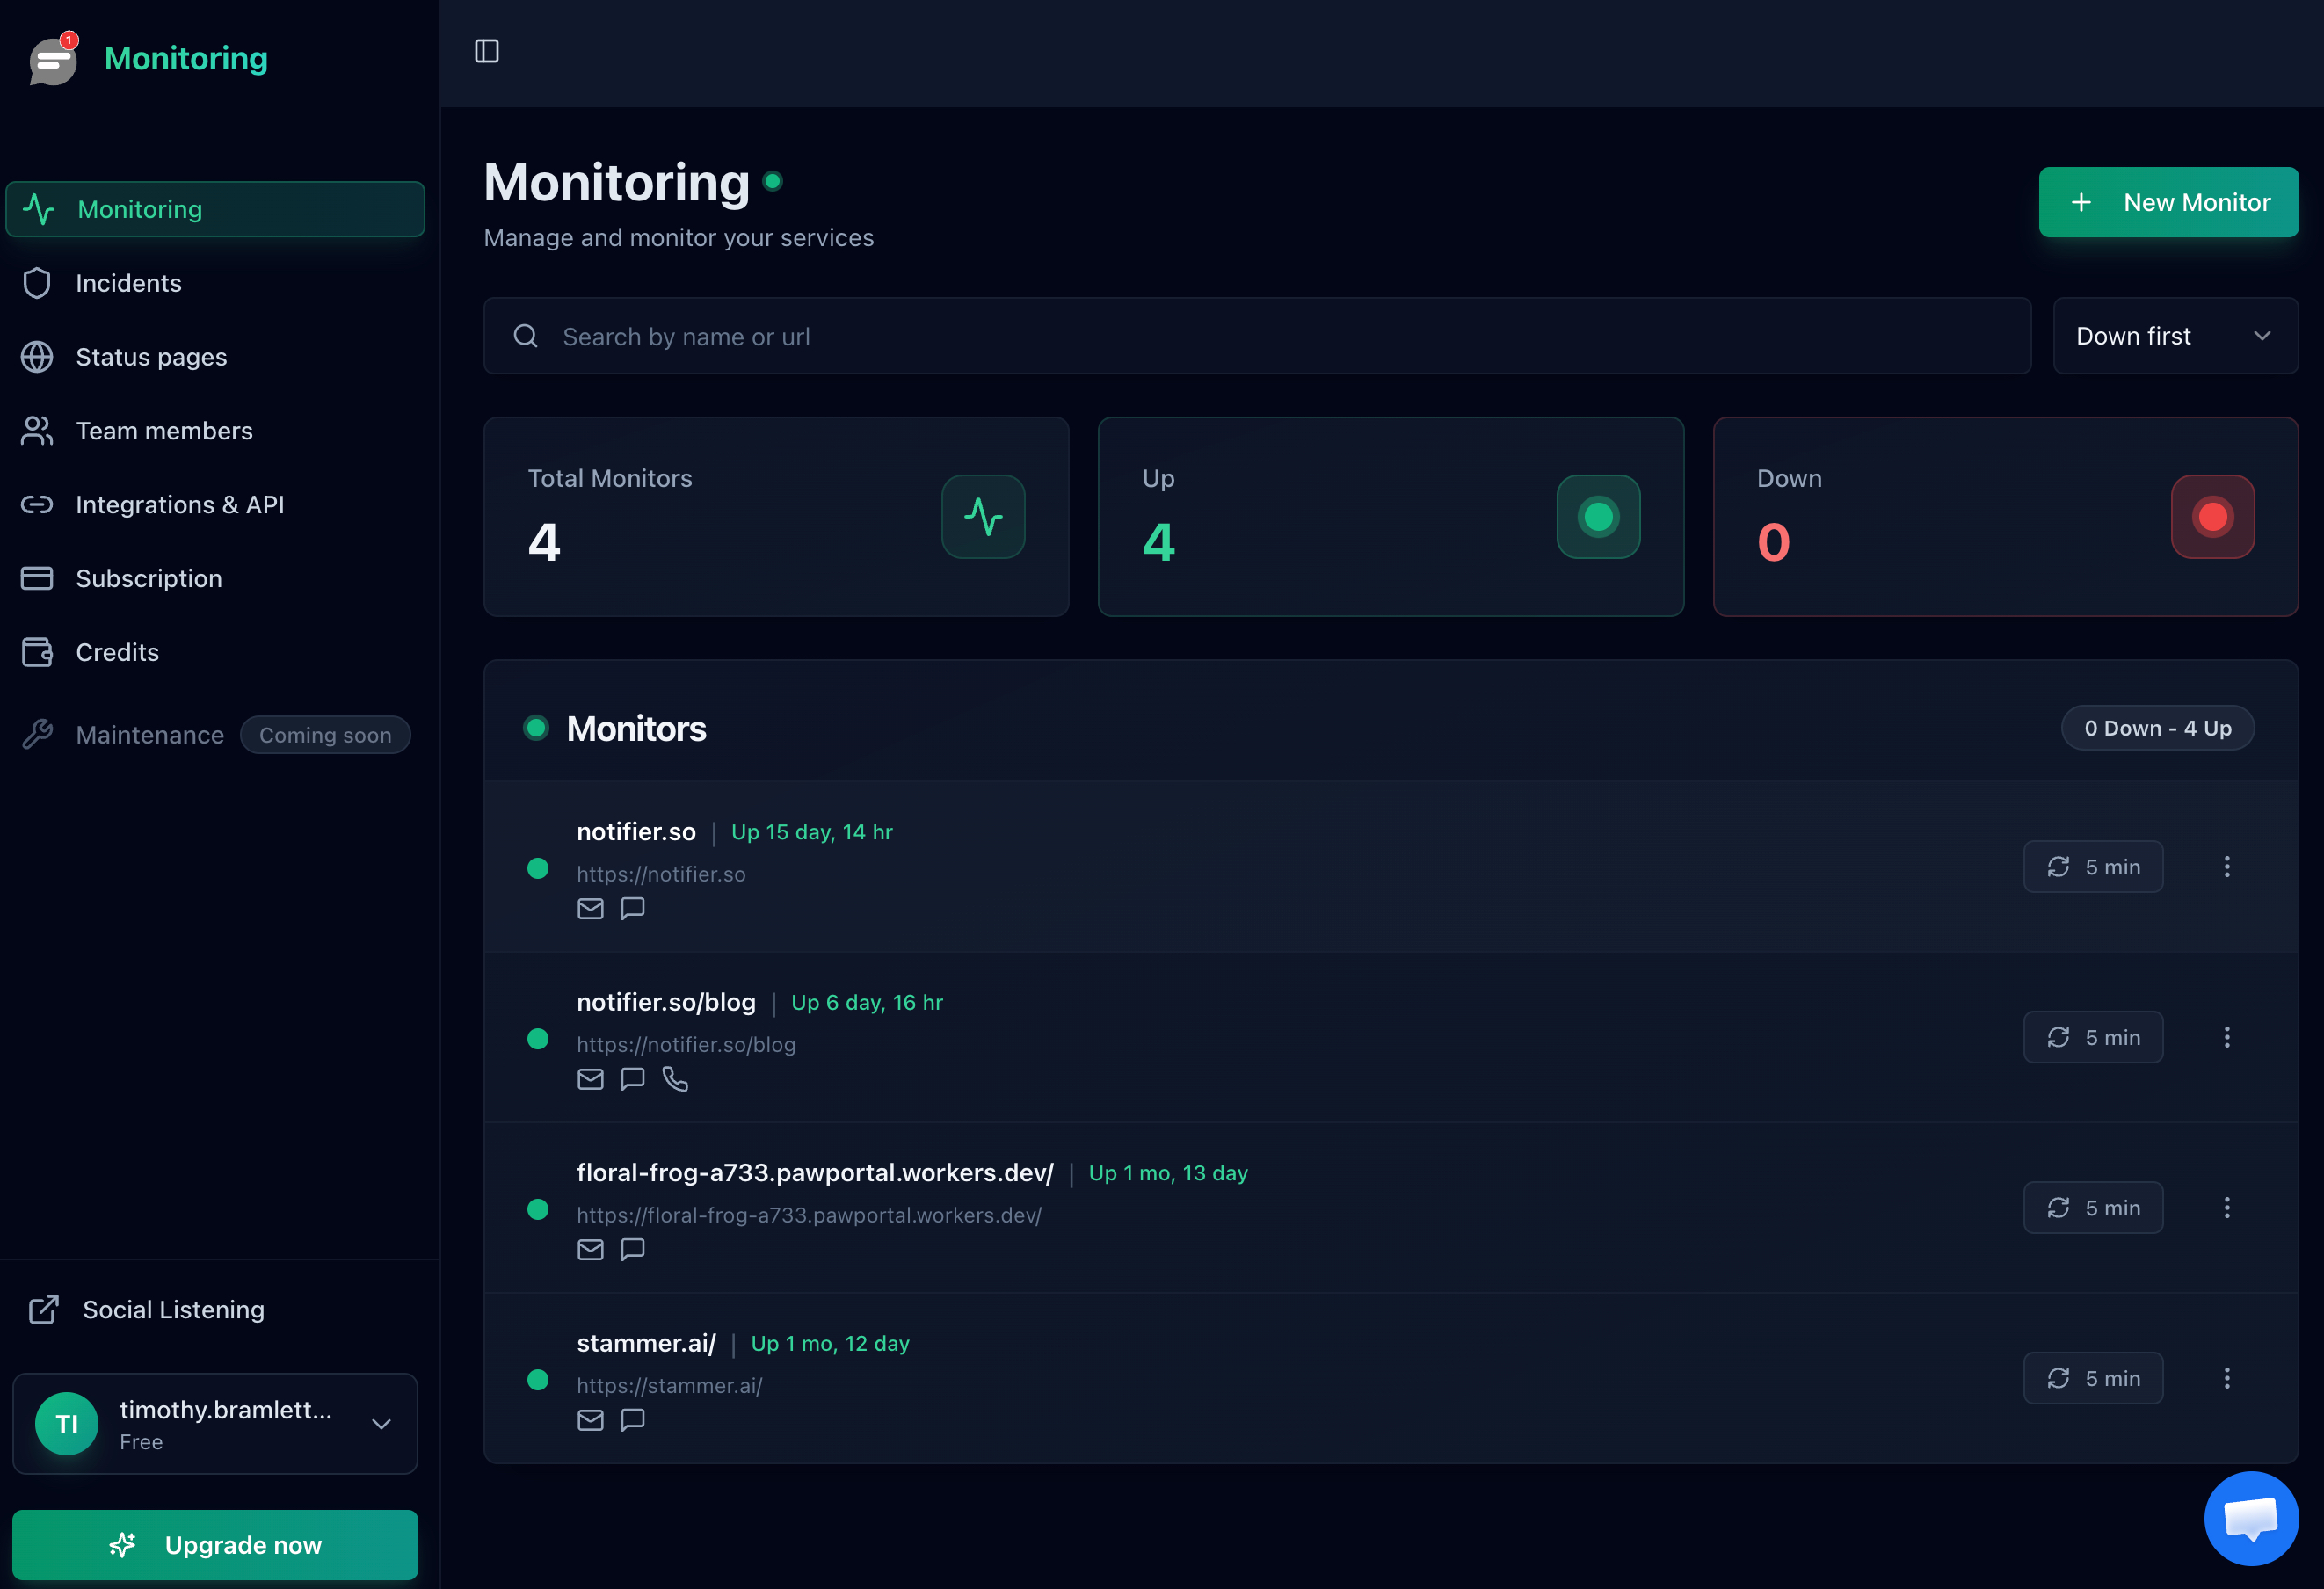
One dashboard per site, with each important path checked separately rather than assuming the homepage represents everything.
Alerts need to reach somebody who can act. Notifier sends alerts by email, SMS, phone call, and Slack on every plan including the free one, and the incident timestamp is usually enough to identify the deploy or server change responsible.
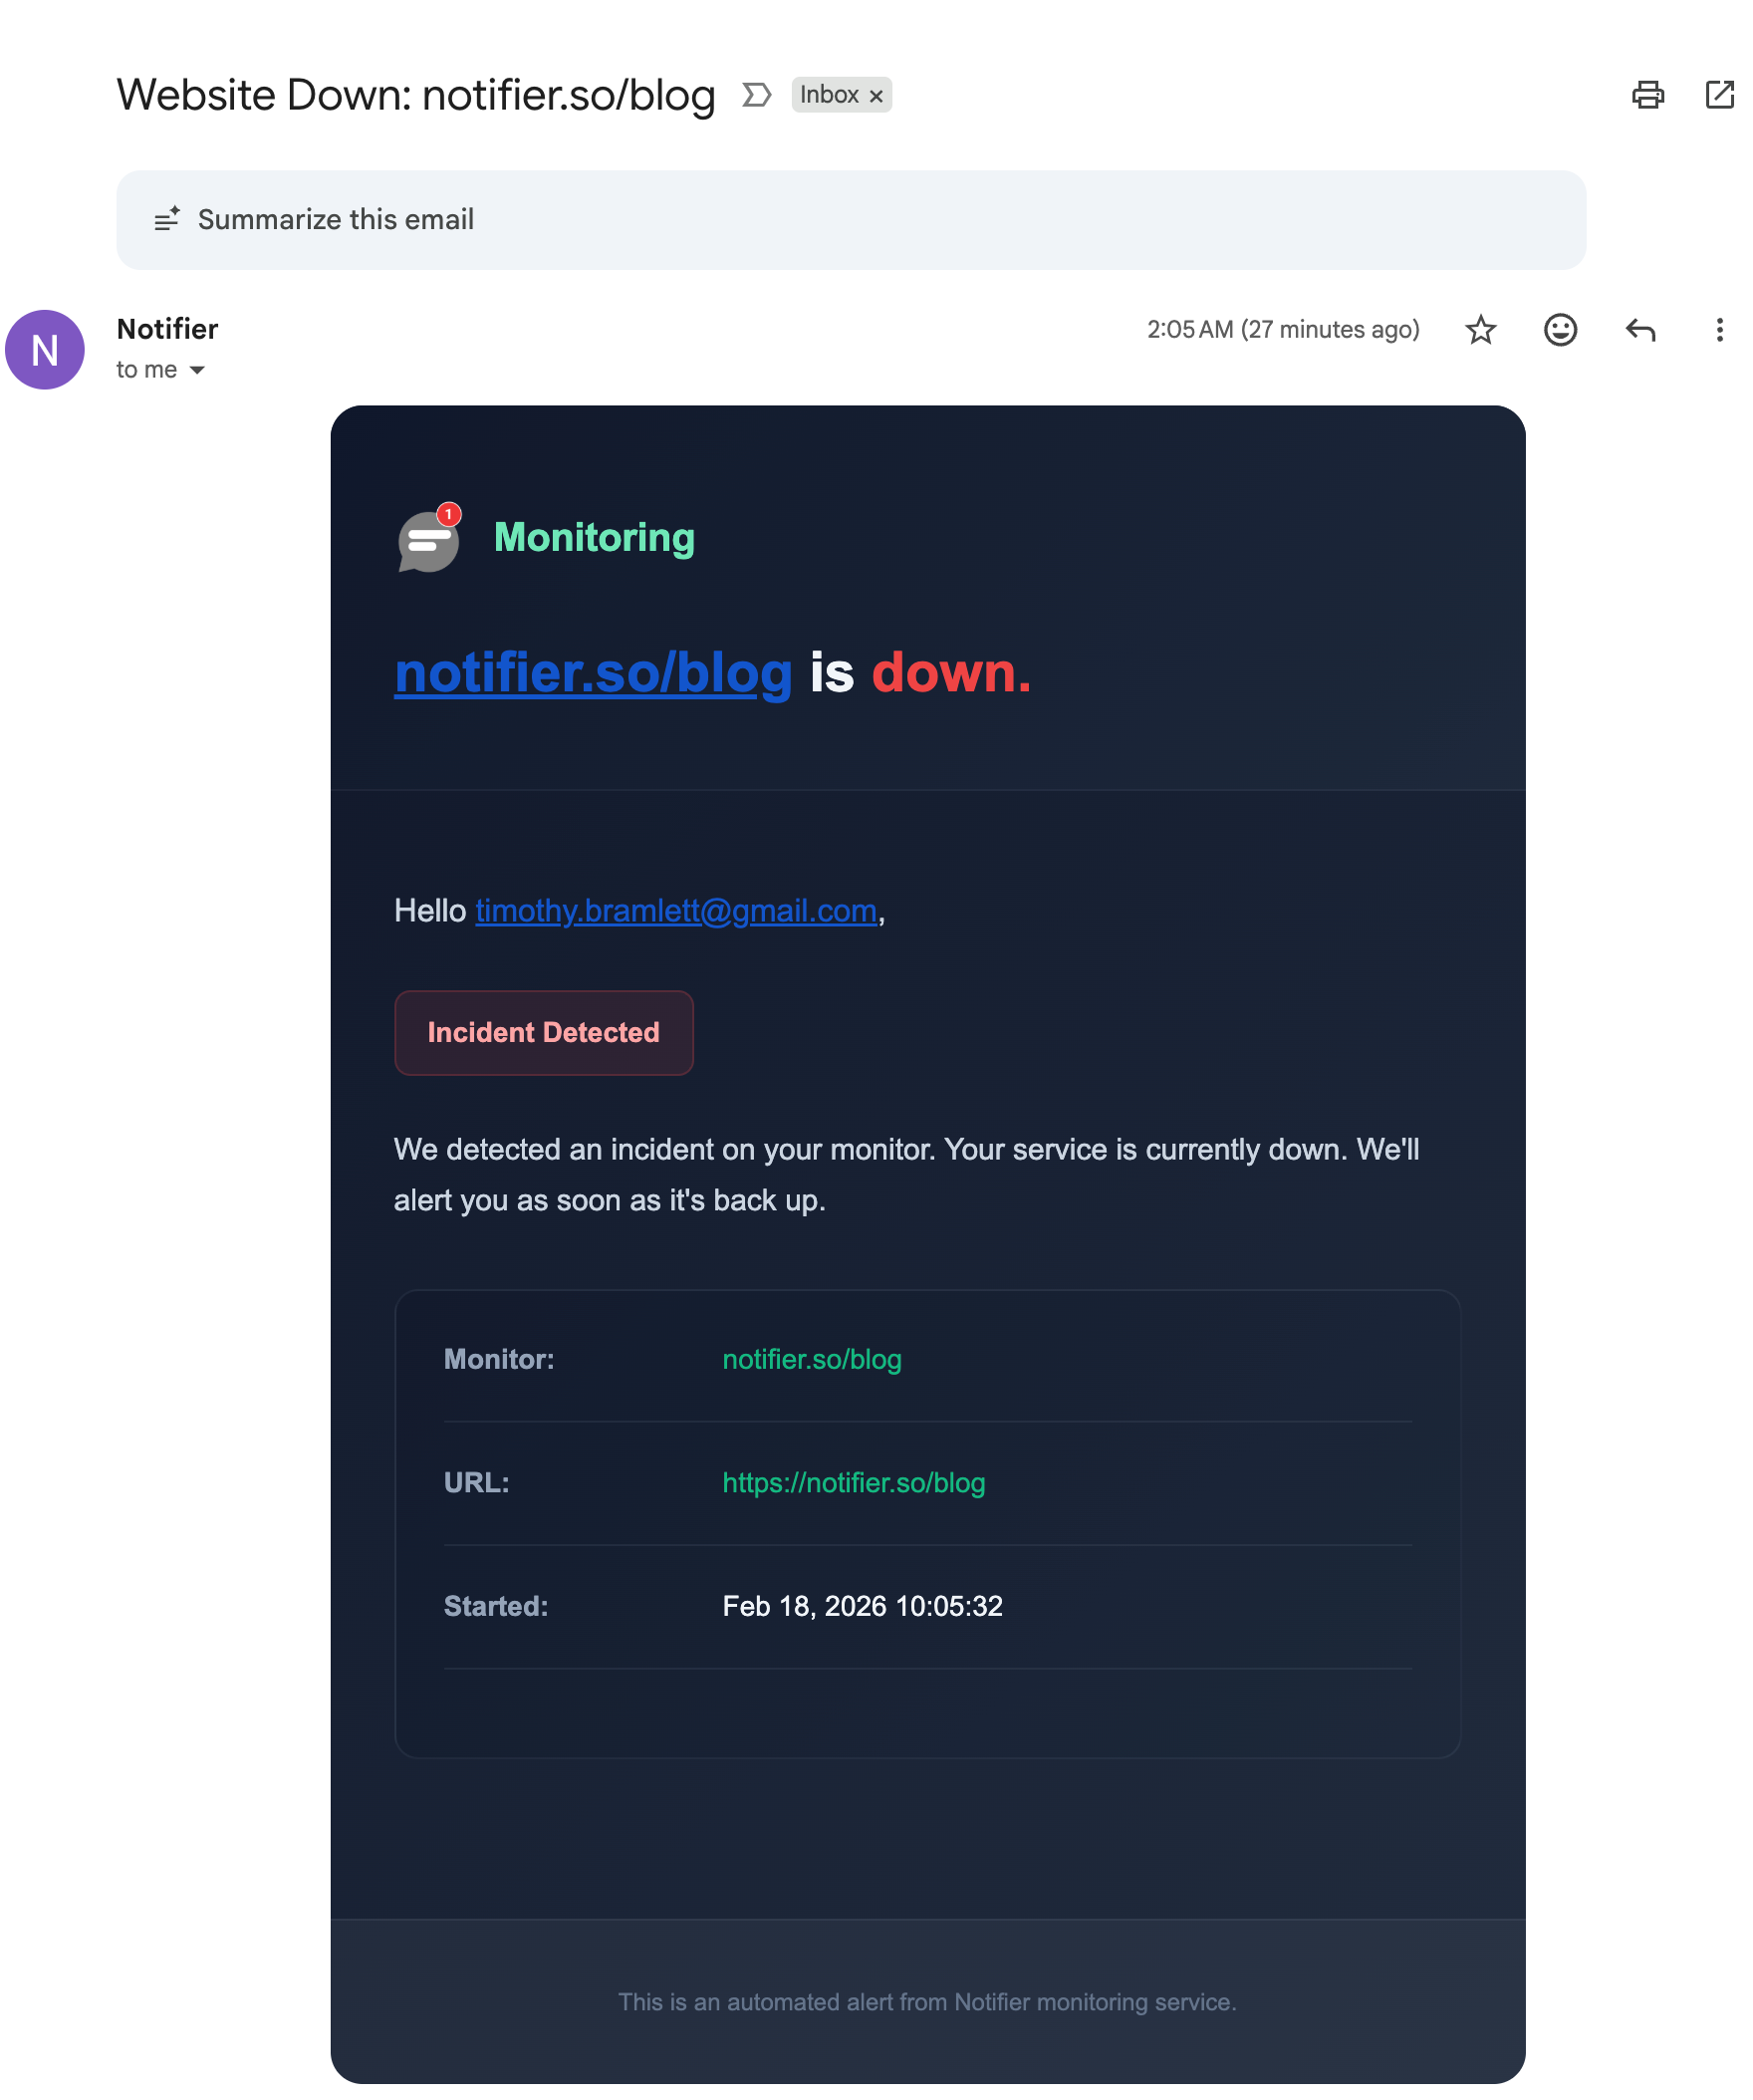
The alert names the monitor and the minute the incident began, which usually points straight at the change that caused it.
Free Monitoring Tiers Compared
You do not need to spend anything to know when a page stops responding. Here is what the main free tiers actually give you:
| Tool | Free Tier | SSL Monitoring | Notes |
|---|---|---|---|
| Notifier | 10 monitors, 5 min checks, 5 status pages | Free on every plan | Email, SMS, phone, and Slack alerts on free. Commercial use allowed. Solo is $4/month for 20 monitors at 1 minute. |
| UptimeRobot | 50 monitors, 5 min checks, 1 status page | Included | Free plan is non-commercial only. SMS and voice sold as credits. |
| Better Stack | 10 monitors, 3 min checks, 1 status page | Included | Strong incident management, but pricing is per responder and adds up quickly for a team. |
| StatusCake | 10 monitors, 5 min checks | 1 SSL monitor on free | Status pages are a separate paid product, and SMS uses paid credits. |
| Uptime Kuma | Unlimited, self-hosted | Included | Free and flexible, but you have to host and maintain it, and it cannot tell you your server is unreachable if it runs on that server. |
Important: UptimeRobot restricted its free plan to non-commercial use only in October 2024. If the site belongs to a business or a client, that free tier is not an option. Notifier's free tier has no such restriction.
Pricing changes, so verify before committing. Our comparison of free website monitoring tools covers each free tier in detail, and how to set up website monitoring walks through setup in about five minutes. Certificate expiry is the other configuration failure that takes sites offline on a schedule, and SSL certificate monitoring is free on every Notifier plan. If broken uploads are one of several recurring problems, what causes website downtime covers the wider set of failure patterns, and why your website keeps going down works through the recurring ones.
Frequently Asked Questions
What does 413 Request Entity Too Large mean?
It means the request body you sent, usually a file upload or a large form, exceeded the maximum size a server in the path is configured to accept, so it refused to process it. RFC 9110 renames the status to Content Too Large and you will also see Payload Too Large, but all three describe the same thing. Nothing is broken and nothing is down. A byte count was compared against a configured number and lost, and the fix is to find which layer holds that number and raise it.
How do I fix a 413 error on Nginx?
Set client_max_body_size to a value above your largest legitimate upload, then reload Nginx with nginx -t followed by systemctl reload nginx. The default is only 1 MB, which a single phone photo exceeds. Put the directive in the http block of nginx.conf so every site and both the HTTP and HTTPS server blocks inherit it, since setting it only in the port 80 block is the most common reason the change appears to do nothing. Run nginx -T and grep for client_max_body_size to see every place it is defined, because a location block will override a wider setting.
Why did increasing upload_max_filesize not fix my 413?
Because PHP was probably never the limit. A request crosses several layers and each enforces its own maximum independently, with the smallest one winning. PHP also does not return 413 at all: when post_max_size is exceeded it discards the body and hands your script an empty $_POST and $_FILES, so you get a blank form or a silent failure rather than an error page. If you are seeing a real 413 page, the rejection came from Nginx, Apache, ModSecurity, or a CDN sitting in front of PHP. Also check that post_max_size is larger than upload_max_filesize and that you restarted PHP-FPM, since reloading Nginx does not apply PHP settings.
How do I increase the maximum upload size in WordPress?
Raise upload_max_filesize and post_max_size in php.ini or your PHP-FPM pool file, raise memory_limit for image processing, and raise client_max_body_size if you run Nginx. Check the result under Media, then Add New, where WordPress prints the effective "Maximum upload file size." On multisite there is a separate cap in Network Admin, then Settings, called "Max upload file size," which defaults to 1500 KB and overrides everything else. Ignore the common advice to use php_value in .htaccess or ini_set in wp-config.php, since neither works on a modern PHP-FPM setup and both fail without any error message.
Does Cloudflare cause 413 errors?
Yes, and it is easy to miss because nothing appears in your server logs. Cloudflare enforces a maximum upload size per plan: 100 MB on Free and Pro, 200 MB on Business, and 500 MB on Enterprise, where it can be self served up to 5 GB. Confirm it by testing the origin directly with curl using the resolve flag. If that succeeds while the proxied request fails, Cloudflare is the limit. The proper fix for genuinely large files is uploading directly to object storage with a presigned URL rather than routing them to a grey clouded subdomain, which permanently exposes your origin IP address.
Why does my upload fail with a connection reset instead of a 413?
Because the server rejected the request while the browser was still sending the file. Nginx reads the Content-Length header, sees it exceeds client_max_body_size, sends the 413, and closes the connection, but the browser is mid upload and never reads the response before the socket dies, so it reports a network error instead. The confirming evidence is a "client intended to send too large body" line in your Nginx error log at the same timestamp. Raise the limit and both symptoms disappear. Testing with curl rather than a browser will also show you the real status code.
What is the difference between 413, 414, and 431?
They describe which part of the request was too big. A 413 means the body, which is the file or form data you submitted. A 414 means the URL itself, usually from a GET form with many fields or a query string built in a loop. A 431 means the headers, which in practice almost always means cookies, though Nginx and IIS tend to send a 400 for that case instead of the technically correct 431. Only a 413 has anything to do with uploads.
Should my code retry a request that returns 413?
No. A 413 is deterministic, so the identical payload will be refused identically every time. Retrying burns quota, delays the failure, and on a large body wastes real bandwidth. Retry logic belongs on 429, 502, 503, and timeouts, where a later attempt can succeed. Fail immediately, log the payload size along with the URL and method, and alert a human. If the payload is a batch, the right response is to split it and send smaller chunks rather than to try the same request again.
What is the right maximum upload size to configure?
Set it to a little above your largest legitimate upload rather than as high as possible, and never to unlimited. For a typical site accepting documents and photos, 25 to 64 MB is generous. Past roughly 100 MB, stop raising limits and switch to presigned direct uploads to object storage, because every large upload through your web server ties up a worker for its whole duration and multiplies the damage of a traffic spike. Whatever number you choose, show it in the upload form and validate it in the browser so users are refused politely before the upload starts.
Will uptime monitoring tell me about a 413?
Not directly, and no monitoring service will, because uptime checks are read only by design. A monitor that uploaded test files to your forms every minute would fill your storage with junk, so a broken upload limit stays invisible to it. Assert your upload limit with a curl command in your deploy script instead, treating only a 413 as a failure. Use monitoring for the far larger category of problems that take pages down outright. Notifier is free for 10 monitors with SSL and DNS monitoring included, and paid plans start at $4/month for 1-minute checks with email, SMS, phone call, and Slack alerts.