At a Glance
- •429 Too Many Requests means a rate limiter counted too many requests from you (by IP address, account, or API key) in a short window and refused the next one. The server is up and working as designed, and the limit usually resets within minutes.
- •As a visitor: stop refreshing, wait a few minutes, turn off your VPN (VPN servers share one IP among many users), and close duplicate tabs. On logged in services the limit is tied to your account, so switching networks will not help.
- •On your own site, the most common cause is a limiter that sees every visitor as the same IP because the site is behind Cloudflare, a load balancer, or a proxy. Check the client address in your Nginx error log for "limiting requests" messages.
- •The next most common causes are limits applied to every image, script, and AJAX call instead of just pages, and Nginx limit_req rules with no burst value, where rate=60r/m actually means one request per second. Nginx returns 503 for these by default, not 429.
- •A monitor sends one request per check, so a 429 on a monitor means real visitors are likely blocked too. Notifier is free for 10 monitors with SSL and DNS monitoring included, and paid plans start at $4/month for 1-minute checks.
429 Too Many Requests is the only common HTTP error that means the server is working exactly as designed. Something counted your requests, decided you had sent too many in too short a time, and refused the next one on purpose. Nothing crashed, nothing is misconfigured in the usual sense, and the server is up.
That makes the fix unusual too. You are not repairing a failure, you are working out which rate limiter fired, who it thinks you are, and whether its idea of "too many" matches reality. On a site you own, the answer is very often that a limiter is counting thousands of different visitors as one person, or that it is counting the 40 files a single page load requests as 40 separate attempts.
This guide covers what a 429 actually tells you, a short list of visitor fixes that work, a diagnosis that identifies the responsible layer in under a minute, the three causes behind nearly every unexpected 429, how API clients should handle it, and what it does to your search rankings. If you do not run the site, jump to the visitor section.
What 429 Too Many Requests Actually Means
The 429 status code was defined in RFC 6585 in 2012 for one purpose: telling a client it has exceeded a rate limit. Every rate limiter works the same basic way. It picks a key that identifies the client, counts requests against that key over a window of time, and rejects requests once the count passes a limit.
Almost every unexpected 429 comes from one of those three settings being wrong for real traffic:
- The key is wrong. The limiter identifies clients by IP address, but every request arrives from the same IP, such as a proxy, a load balancer, or Cloudflare. Everyone shares one bucket, and it empties in seconds.
- The limit or window is wrong. The numbers were chosen for a login form and applied to the whole site, or chosen by reading a config example without knowing how the limiter measures time.
- The limit is right. Someone really is sending too many requests, whether a scraper, a brute force script, an aggressive crawler, or your own code stuck in a retry loop.
A well behaved 429 also includes a Retry-After header, which tells the client how long to wait. It can be a number of seconds, such as Retry-After: 60, or a date. Many limiters leave it out, which is why so many clients handle a 429 badly.
How It Differs From Similar Errors
Rate limiting does not always show up as a 429, and a 429 is not the only way a server says "slow down". The useful question is whether the refusal depends on how many requests you sent.
| Status | What It Means | Depends on Request Volume? |
|---|---|---|
| 429 Too Many Requests | A rate limit for your key (IP, user, API token) was exceeded | Yes, by definition |
| 403 Forbidden | You are not allowed to access this resource | Usually no, but some firewalls (Apache mod_evasive, many WAFs) block rate limited IPs with a 403 |
| 503 Service Unavailable | The server cannot handle requests right now | Sometimes. Nginx rate limiting returns 503 by default, not 429 |
| 508 Resource Limit Is Reached | Your hosting account hit its concurrency or resource cap | Indirectly. It limits the whole account, not one visitor |
| Cloudflare error 1015 | "You are being rate limited" by a Cloudflare rule | Yes. It is served with a 429 status code |
The hidden 503s:
Nginx's limit_req and limit_conn reject excess requests with a 503 unless you set limit_req_status 429;. If your site throws short bursts of 503 errors with no crash, no deploy, and no spike in load, search your Nginx config for limit_req before you go looking for an outage. Setting the status to 429 makes these far easier to tell apart in logs and monitoring.
If You Are a Visitor, Not the Site Owner
A 429 is about you, or about the address you are connecting from, so unlike most server errors there are things on your side that genuinely help. Work through these in order.
Stop Refreshing and Wait
Most limits reset within one to fifteen minutes. Every refresh during that time is another request against the limit, and some limiters extend the block each time they reject you. Close the tab, wait a few minutes, and try once. If the page told you how long to wait, wait that long.
Turn Off Your VPN
VPN exit servers carry traffic for hundreds or thousands of users from one IP address. To a site limiting by IP, all of those people look like a single very busy visitor. Disconnect and reload, or switch to a different VPN server. The same applies to office networks, schools, and some mobile carriers, which put many people behind one shared public address.
Close Other Tabs and Disable Busy Extensions
Ten tabs open on the same site all poll it in the background. Extensions that check prices, track stock, or auto refresh pages can send a steady stream of requests you never see. Close duplicate tabs, then try an Incognito window, which runs without most extensions. If it works there, disable extensions one at a time to find the busy one.
Know When It Is Tied to Your Account
On logged in services such as AI chat tools, social networks, and developer APIs, the limit is usually attached to your account, not your network. Switching Wi-Fi or turning off a VPN will not reset it. Only waiting for the window to pass, or moving to a plan with a higher limit, will.
What will not help:
Flushing DNS, clearing your browser cache, and resetting your network adapter. The server received and counted your request perfectly well, and none of those change your IP address or your account. If you see a 429 on every device and every network, including mobile data with Wi-Fi off, the site's limiter is probably misconfigured, and you can check whether others are affected with our guide to whether a site is down for everyone or just you.
Diagnose It in Three Steps
A typical site has three or four places that can return a 429: a CDN or WAF, the web server, a security plugin, and the application itself. They all send the same status code. The first job is finding out which one is responsible, because fixing the wrong layer changes nothing.
Step 1: Read the Response Headers and Body
curl -s -D - -o body.txt https://example.com/ | grep -iE "^HTTP|^server|retry-after|ratelimit|cf-ray"
head -c 500 body.txt
The headers and body almost always name the layer that fired:
| What You See | Layer Responsible | Where to Look Next |
|---|---|---|
server: cloudflare and "error code: 1015" in the body |
A Cloudflare rate limiting rule | Security Events in the Cloudflare dashboard |
server: nginx and a plain Nginx error page |
Nginx limit_req |
The Nginx error log (step 3) |
| JSON body such as "Request was throttled. Expected available in 12 seconds." | Django REST Framework throttling | DEFAULT_THROTTLE_RATES in settings |
| "Too Many Attempts." | Laravel's throttle middleware | Route middleware and RateLimiter definitions |
"Too many requests, please try again later." with RateLimit-* headers |
Node.js express-rate-limit | The limiter options and your trust proxy setting |
| A branded page from your host or a WordPress security plugin | Hosting WAF or plugin | The plugin's blocked IP list, or hosting support |
Step 2: Measure the Limit
Send a controlled burst and watch where the 429s begin. Only do this against a site you own:
for i in $(seq 1 30); do
  curl -s -o /dev/null -w "$i %{http_code} %{time_total}s\n" https://example.com/
done| Pattern | What It Suggests | Go To |
|---|---|---|
| The very first request returns 429, from a fresh IP | You share a bucket with everyone else | Cause 1 |
| The 2nd or 3rd request fails, then some succeed again | A per second limit with no burst allowance | Cause 2 |
| All 30 succeed, but real page loads still fail | The limit counts assets or AJAX calls, not pages | Cause 2 |
| All 30 succeed, and only some visitors are blocked | Those visitors share an IP, or real abuse is filling the limit | Cause 1 or Cause 3 |
Step 3: Find the Key in the Logs
Nginx logs every rejection in the error log, including the zone and the client key it counted:
sudo grep "limiting requests" /var/log/nginx/error.log | tail -n 5

# Example output
limiting requests, excess: 20.460 by zone "perip", client: 172.70.34.12, server: example.com, request: "GET /cart/ HTTP/1.1"
Look closely at client. If it is a Cloudflare address, your load balancer, or a private address like 172.17.0.1 or 10.0.0.5, you have found cause one. To see who is actually generating the most requests, count 429s and top IPs in the access log (this assumes the default combined log format):
# How many 429s per hour
sudo awk '$9 == 429 {print substr($4, 2, 14)}' /var/log/nginx/access.log | sort | uniq -c

# Which IPs received them
sudo awk '$9 == 429 {print $1}' /var/log/nginx/access.log | sort | uniq -c | sort -rn | head

# Which URLs were limited
sudo awk '$9 == 429 {print $7}' /var/log/nginx/access.log | sort | uniq -c | sort -rn | head
Cause 1: Every Visitor Looks Like the Same IP
This is the most damaging cause, because it does not limit one heavy user. It limits your entire audience at once, usually right when traffic is highest. It happens whenever a rate limiter keys on the connecting IP address and something sits in front of the application that makes every connection come from the same place.
The classic trigger is putting a site behind Cloudflare, a load balancer, or a reverse proxy without telling the layers behind it where the real client address is. A limit of 10 requests per second per visitor becomes 10 requests per second for the whole site, and a normal traffic spike turns into a wall of 429s.
Nginx Behind Cloudflare or a Load Balancer
$binary_remote_addr is the address of whatever connected to Nginx. Behind Cloudflare, that is a Cloudflare edge server. Use the real IP module so Nginx replaces it with the visitor's address before rate limiting runs:
# In the http block. Add every range from https://www.cloudflare.com/ips/
set_real_ip_from 173.245.48.0/20;
set_real_ip_from 103.21.244.0/22;
# ...remaining IPv4 and IPv6 ranges...
real_ip_header CF-Connecting-IP;

# Behind an AWS ALB or your own proxy instead:
# set_real_ip_from 10.0.0.0/8;
# real_ip_header X-Forwarded-For;
# real_ip_recursive on;
Only trust addresses you control: set_real_ip_from must list only your proxy's addresses. If you trust the header from anywhere, any client can send a fake CF-Connecting-IP or X-Forwarded-For with a new random value on every request and walk straight past your rate limit.
Application Frameworks Behind a Proxy
Application level limiters have the same problem and their own setting to fix it:
| Stack | Symptom | Fix |
|---|---|---|
| Express with express-rate-limit | req.ip is the proxy's address |
app.set('trust proxy', 1), set to the number of proxies in front of the app |
| Django REST Framework | Anonymous throttles all key on the proxy IP | Set NUM_PROXIES in REST_FRAMEWORK settings |
| Laravel | $request->ip() is the load balancer |
Configure trusted proxies for your load balancer's addresses |
| Docker | Every client appears as the bridge gateway, often 172.17.0.1 |
Rate limit at the proxy in front of the container, or pass the real IP through a header you trust |
Real Visitors Who Share an Address
Even with real IPs working, some legitimate visitors share one. Mobile carriers use carrier grade NAT that puts many phones behind one public IPv4 address, and offices, universities, and VPN providers do the same. If your 429s cluster on a handful of IPs that turn out to be a mobile carrier or a customer's office, raise the per IP limit or key logged in users by account instead of IP. Per IP limits work best as a loose safety net, with tight limits reserved for specific actions.
Cause 2: The Limit Does Not Match Real Traffic
The second most common cause is a limit that is reasonable on paper and wrong in practice. A number that makes sense for a login form gets applied to every request, or a config gets copied without understanding how the limiter measures time.
A Page Is Not One Request
Loading one page in a browser can easily trigger 30 to 100 requests: stylesheets, scripts, fonts, images, and API calls from the page itself. A modern single page app may fire a dozen API requests just to render its first screen. If a limit of "20 requests per second" is applied to location /, it counts all of them, and a visitor clicking quickly between two pages is blocked. Exclude static files from general rate limiting and put tight limits only where they belong:
limit_req_zone $binary_remote_addr zone=general:10m rate=10r/s;
limit_req_zone $binary_remote_addr zone=login:10m rate=5r/m;
limit_req_status 429;

server {
    # Loose limit for dynamic pages, with room for bursts
    location / {
        limit_req zone=general burst=50 nodelay;
        # ...
    }

    # No rate limit on static assets
    location ~* \.(css|js|png|jpg|jpeg|webp|svg|woff2?)$ {
        expires 30d;
    }

    # Tight limit only where brute force happens
    location = /wp-login.php {
        limit_req zone=login burst=5 nodelay;
        # ...
    }
}
The Nginx Burst Trap
This catches more people than any other setting. Nginx does not count requests over a window and reset. It enforces the rate evenly. rate=60r/m does not mean "60 requests in any minute", it means "one request per second". rate=10r/s means one request every 100 milliseconds. Without a burst value, two requests arriving in the same instant break the limit, and the second one is rejected.
burst=50 lets up to 50 extra requests queue above the rate. Adding nodelay serves those queued requests immediately instead of spacing them out, which is what you want for page loads. A limit with no burst is almost always a mistake on anything a browser touches.
WordPress: admin-ajax.php and Logged In Editors
On WordPress, many plugins and the Heartbeat API send repeated requests to /wp-admin/admin-ajax.php in the background. An editor with several admin tabs open, or a page builder autosaving, can generate a steady stream from one IP. If your security plugin or host rate limits that path, editors get 429s while the public site looks fine. Check the plugin's rate limiting or brute force settings first, and ask your host whether their firewall limits admin-ajax.php, since many hosts apply their own rules you cannot see in WordPress.
Legitimate Integrations and Webhooks
Payment processors, shipping providers, and other services send webhooks in bursts, often from a small set of IPs. A limiter that blocks them causes failed orders that do not look like an error on your site at all. Exempt verified webhook endpoints from general rate limits and validate them by signature instead.
Cause 3: Someone Really Is Sending Too Many Requests
Sometimes the limiter is right. If step three showed a handful of IPs or user agents responsible for most of the 429s, the rate limit is doing its job, and the question becomes whether that traffic is worth serving at all.
-
Brute force against logins: repeated POST requests to
/wp-login.php,/xmlrpc.php, or your app's login endpoint. Keep the tight limit, and blockxmlrpc.phpentirely if nothing you use needs it. - Scrapers and AI crawlers: bursts of GET requests across many URLs from cloud provider IP ranges. A 429 is a polite and effective answer. For crawlers that ignore it, block by user agent or ASN at your CDN.
- Search filters and query strings: bots crawling every combination of filters and sort orders on a shop or listing page. Rate limit the filtered URLs and disallow them in robots.txt.
- Your own code: a frontend retry loop, a cron job that calls your own API without pausing, or a monitoring script someone wrote years ago. Check whether the top IP in your logs is one of your own servers.
Verify before blocking search engines: anything can claim to be Googlebot in its user agent. Before exempting or blocking a crawler, confirm it with a reverse DNS lookup: host 66.249.66.1 should return a name ending in googlebot.com or google.com, and a forward lookup of that name should return the same IP.
When abusive traffic keeps pushing the site toward its limits, a rate limit at the edge is far cheaper than one on your server. A Cloudflare rate limiting rule rejects the request before it uses any of your CPU, while an application level throttle still runs your framework for every rejected request. If the load is causing slowdowns or crashes as well as 429s, our guide to what causes website downtime covers the wider picture.
If You Are Getting 429s From an API
When your code calls someone else's API, you cannot change their limit. You can only stop exceeding it and recover gracefully when you do. Retrying immediately is the worst possible response, because every retry counts against the same limit and keeps you blocked for longer.
Read the Rate Limit Headers
Most APIs tell you exactly where you stand on every response, not just on the 429:
Retry-After: 30
RateLimit-Limit: 100
RateLimit-Remaining: 0
RateLimit-Reset: 30

# Older style, used by GitHub and many others
X-RateLimit-Limit: 5000
X-RateLimit-Remaining: 0
X-RateLimit-Reset: 1789653600
Watch Remaining and slow down before it reaches zero. Note that the reset value is a number of seconds in some APIs and a Unix timestamp in others, so check the documentation before using it.
Back Off Exponentially, With Jitter
When you get a 429, wait for Retry-After if it is present. If it is not, wait one second, then two, then four, and so on up to a cap, adding a random amount each time. The randomness matters: without it, every worker that was limited at the same moment retries at the same moment and hits the limit together again.
import random
import time

import requests


def get_with_backoff(url, max_attempts=6):
    for attempt in range(max_attempts):
        response = requests.get(url, timeout=30)
        if response.status_code != 429:
            return response

        retry_after = response.headers.get("Retry-After")
        if retry_after and retry_after.isdigit():
            delay = int(retry_after)
        else:
            delay = min(2 ** attempt, 60)
        time.sleep(delay + random.uniform(0, 1))

    response.raise_for_status()
    return response
Beyond retries, the lasting fixes are making fewer calls: cache responses that do not change often, use batch endpoints where the API offers them, replace polling with webhooks, and run multiple workers through a shared queue so their combined rate stays under the limit. The last one is easy to miss. Five workers that each respect a limit of 10 per second will send 50 per second together.
What 429s Do to Googlebot and Your Rankings
Google treats a 429 as a signal that its crawler is overloading your server, in the same group as 500 and 503 responses. Googlebot slows its crawl rate in response. A short burst of 429s is harmless and is a legitimate way to reduce crawling for a while. The problem is a limiter that keeps rejecting Googlebot for days: pages that persistently return server error codes can eventually be dropped from the index.
If Search Console shows a rise in server errors or a falling crawl rate after you added rate limiting, check your logs for 429s served to verified Googlebot IPs, and loosen the limit for them. Never serve a 429 on your homepage or key landing pages as a permanent way to block crawlers. Use robots.txt for that.
How to Stop It From Happening Again
Rate limiting failures have a nasty property: the site looks completely healthy to you. Your own requests are few, so you are never limited, while visitors behind a busy proxy or a shared carrier IP are turned away. The limiter only fires when traffic is high, which is exactly when a bad limit costs the most. And visitors who see a 429 do not report it. They leave.
Test Your Limits Before Real Traffic Does
After changing any rate limit, load your heaviest page in a browser with the network tab open and click quickly through a few pages. Then run the burst test from step two. If you just put a site behind Cloudflare or a load balancer, confirm the client in your Nginx logs is a real visitor IP before traffic arrives.
Monitor From Outside
An external uptime monitor sends a real HTTP request from a different network on a fixed schedule. A monitor checking every minute or every five minutes will never trip a sensible rate limit by itself, so if its checks start returning 429, your limiter is catching far more than it should, and real visitors are almost certainly being blocked too. Notifier counts a 429 as a failed check and alerts you with the exact time it started, which you can match against the rejections in your logs.
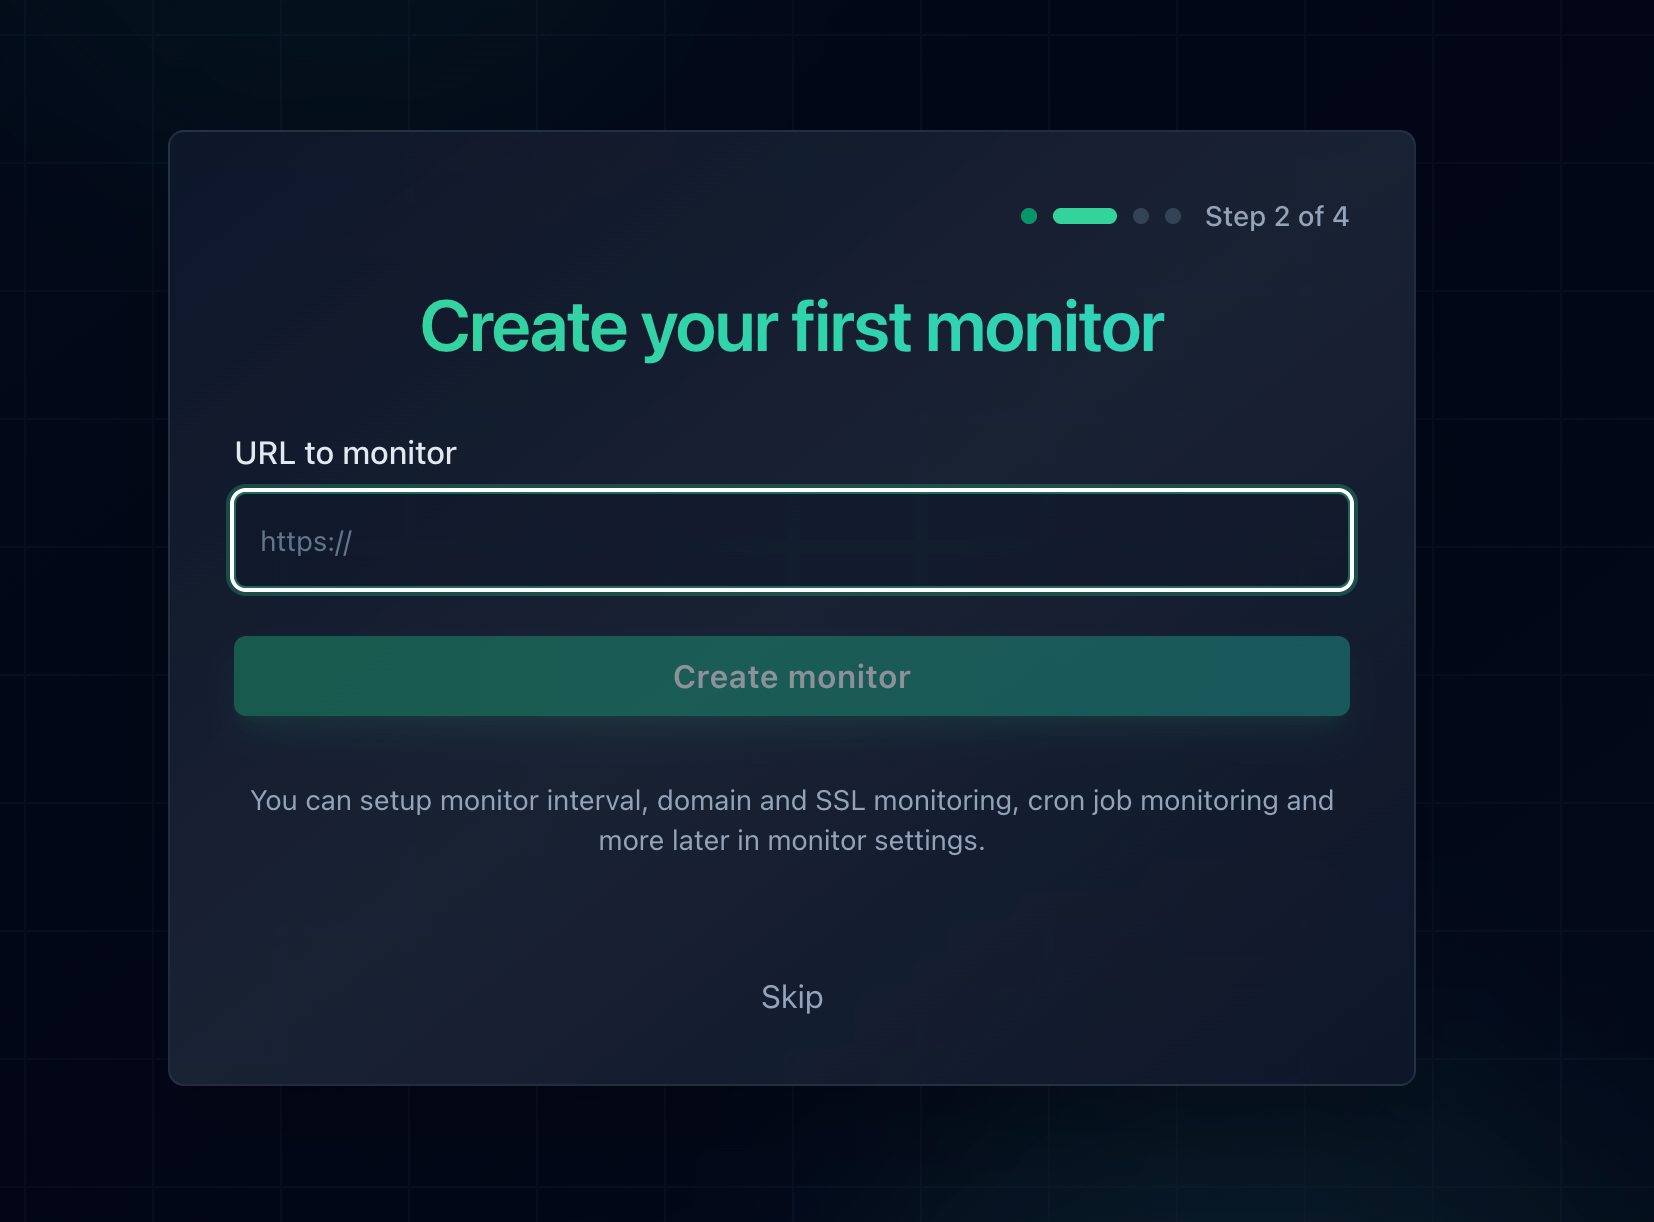
Add the URL, and every check sends a real request that has to get past your rate limits.
Monitor more than the homepage. A cached homepage can be served by your CDN without ever reaching the limiter, while your login page, search, or API is rate limited behind it. If your product has an API, add a monitor for a lightweight endpoint as described in our guide to monitoring an API endpoint. Rising response times are worth watching too, since a site that is struggling under load is often the one where someone reaches for a tighter limit, as covered in how to monitor website response time.
If your bot protection flags the monitor:
Notifier's checks identify themselves with a user agent containing NotifierMonitoring. If an aggressive bot protection rule starts serving 429s to the monitor, you can exempt that user agent in the rule. Keep the exemption narrow, such as limiting it to the monitored URL, since user agents are easy to fake. If you need help, the support team usually replies within minutes through the chat widget or support@notifier.so.
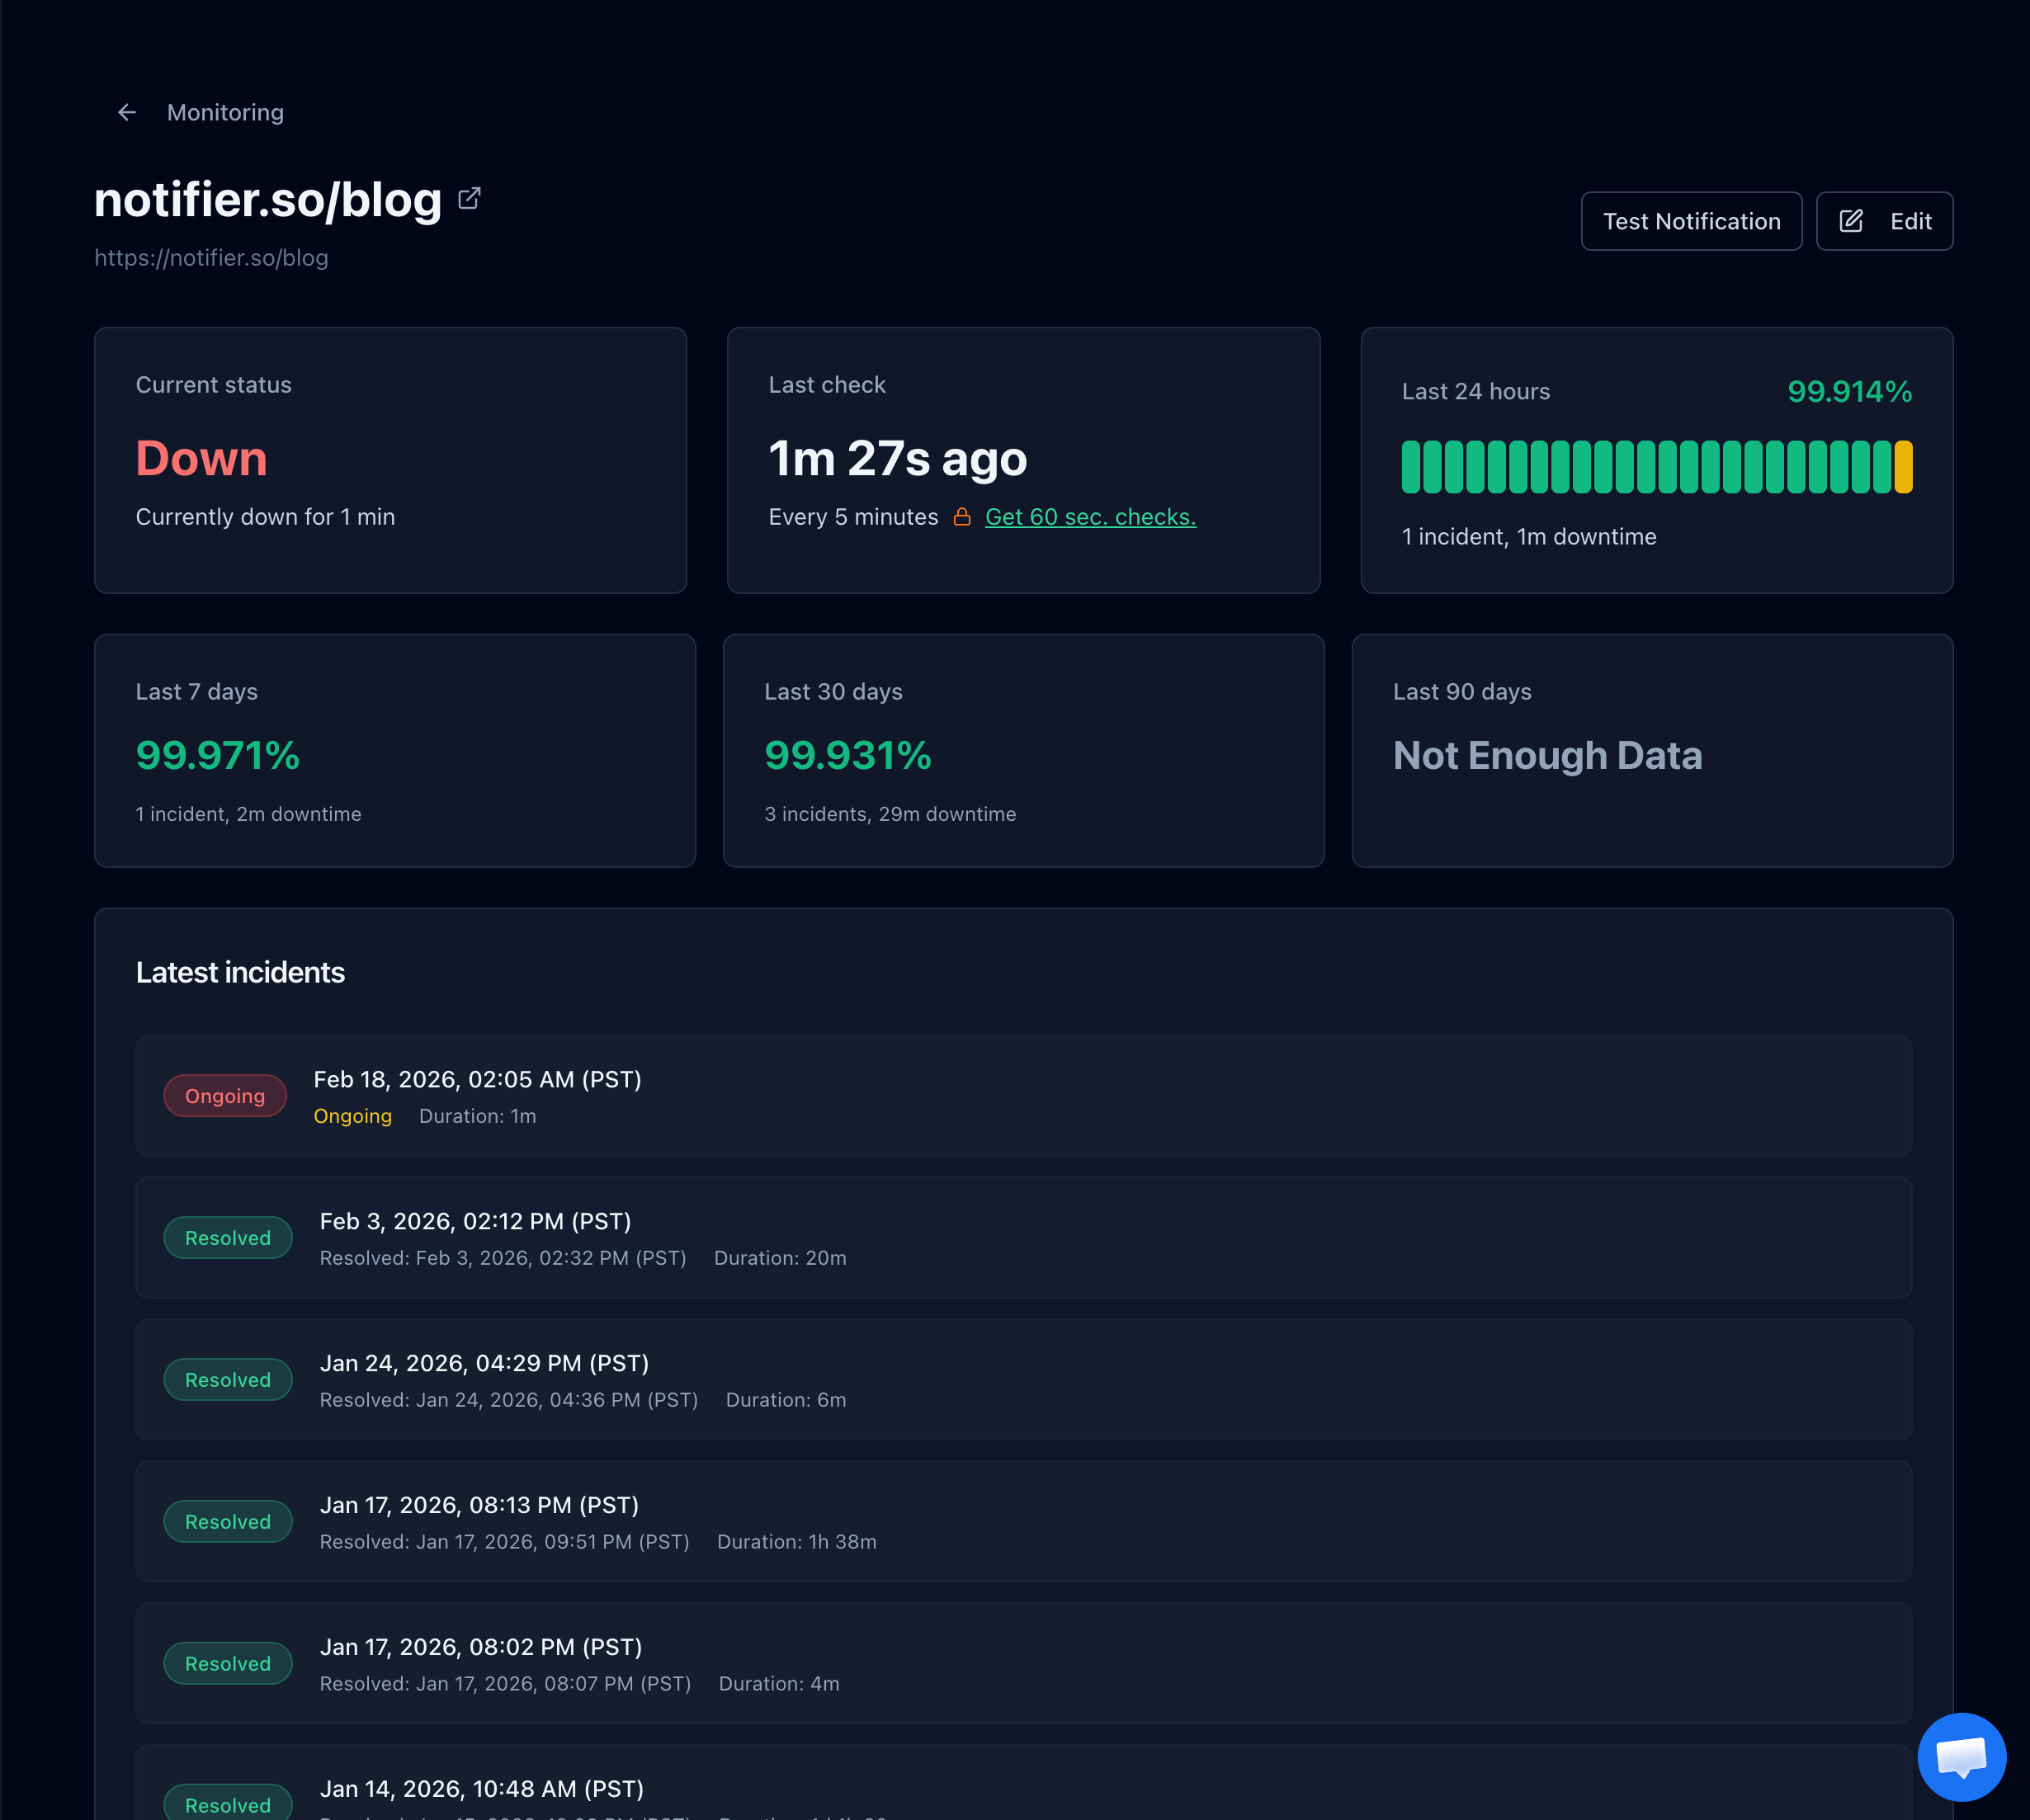
The incident history shows when checks started failing and how long it lasted.
Get the Alert Where You Will See It
Notifier sends email, SMS, phone call, and Slack alerts on every plan, including the free tier, and a recovery alert when checks pass again. SSL certificate and DNS monitoring are included free on every plan as well, so an expiring certificate on the same site does not become the next outage.
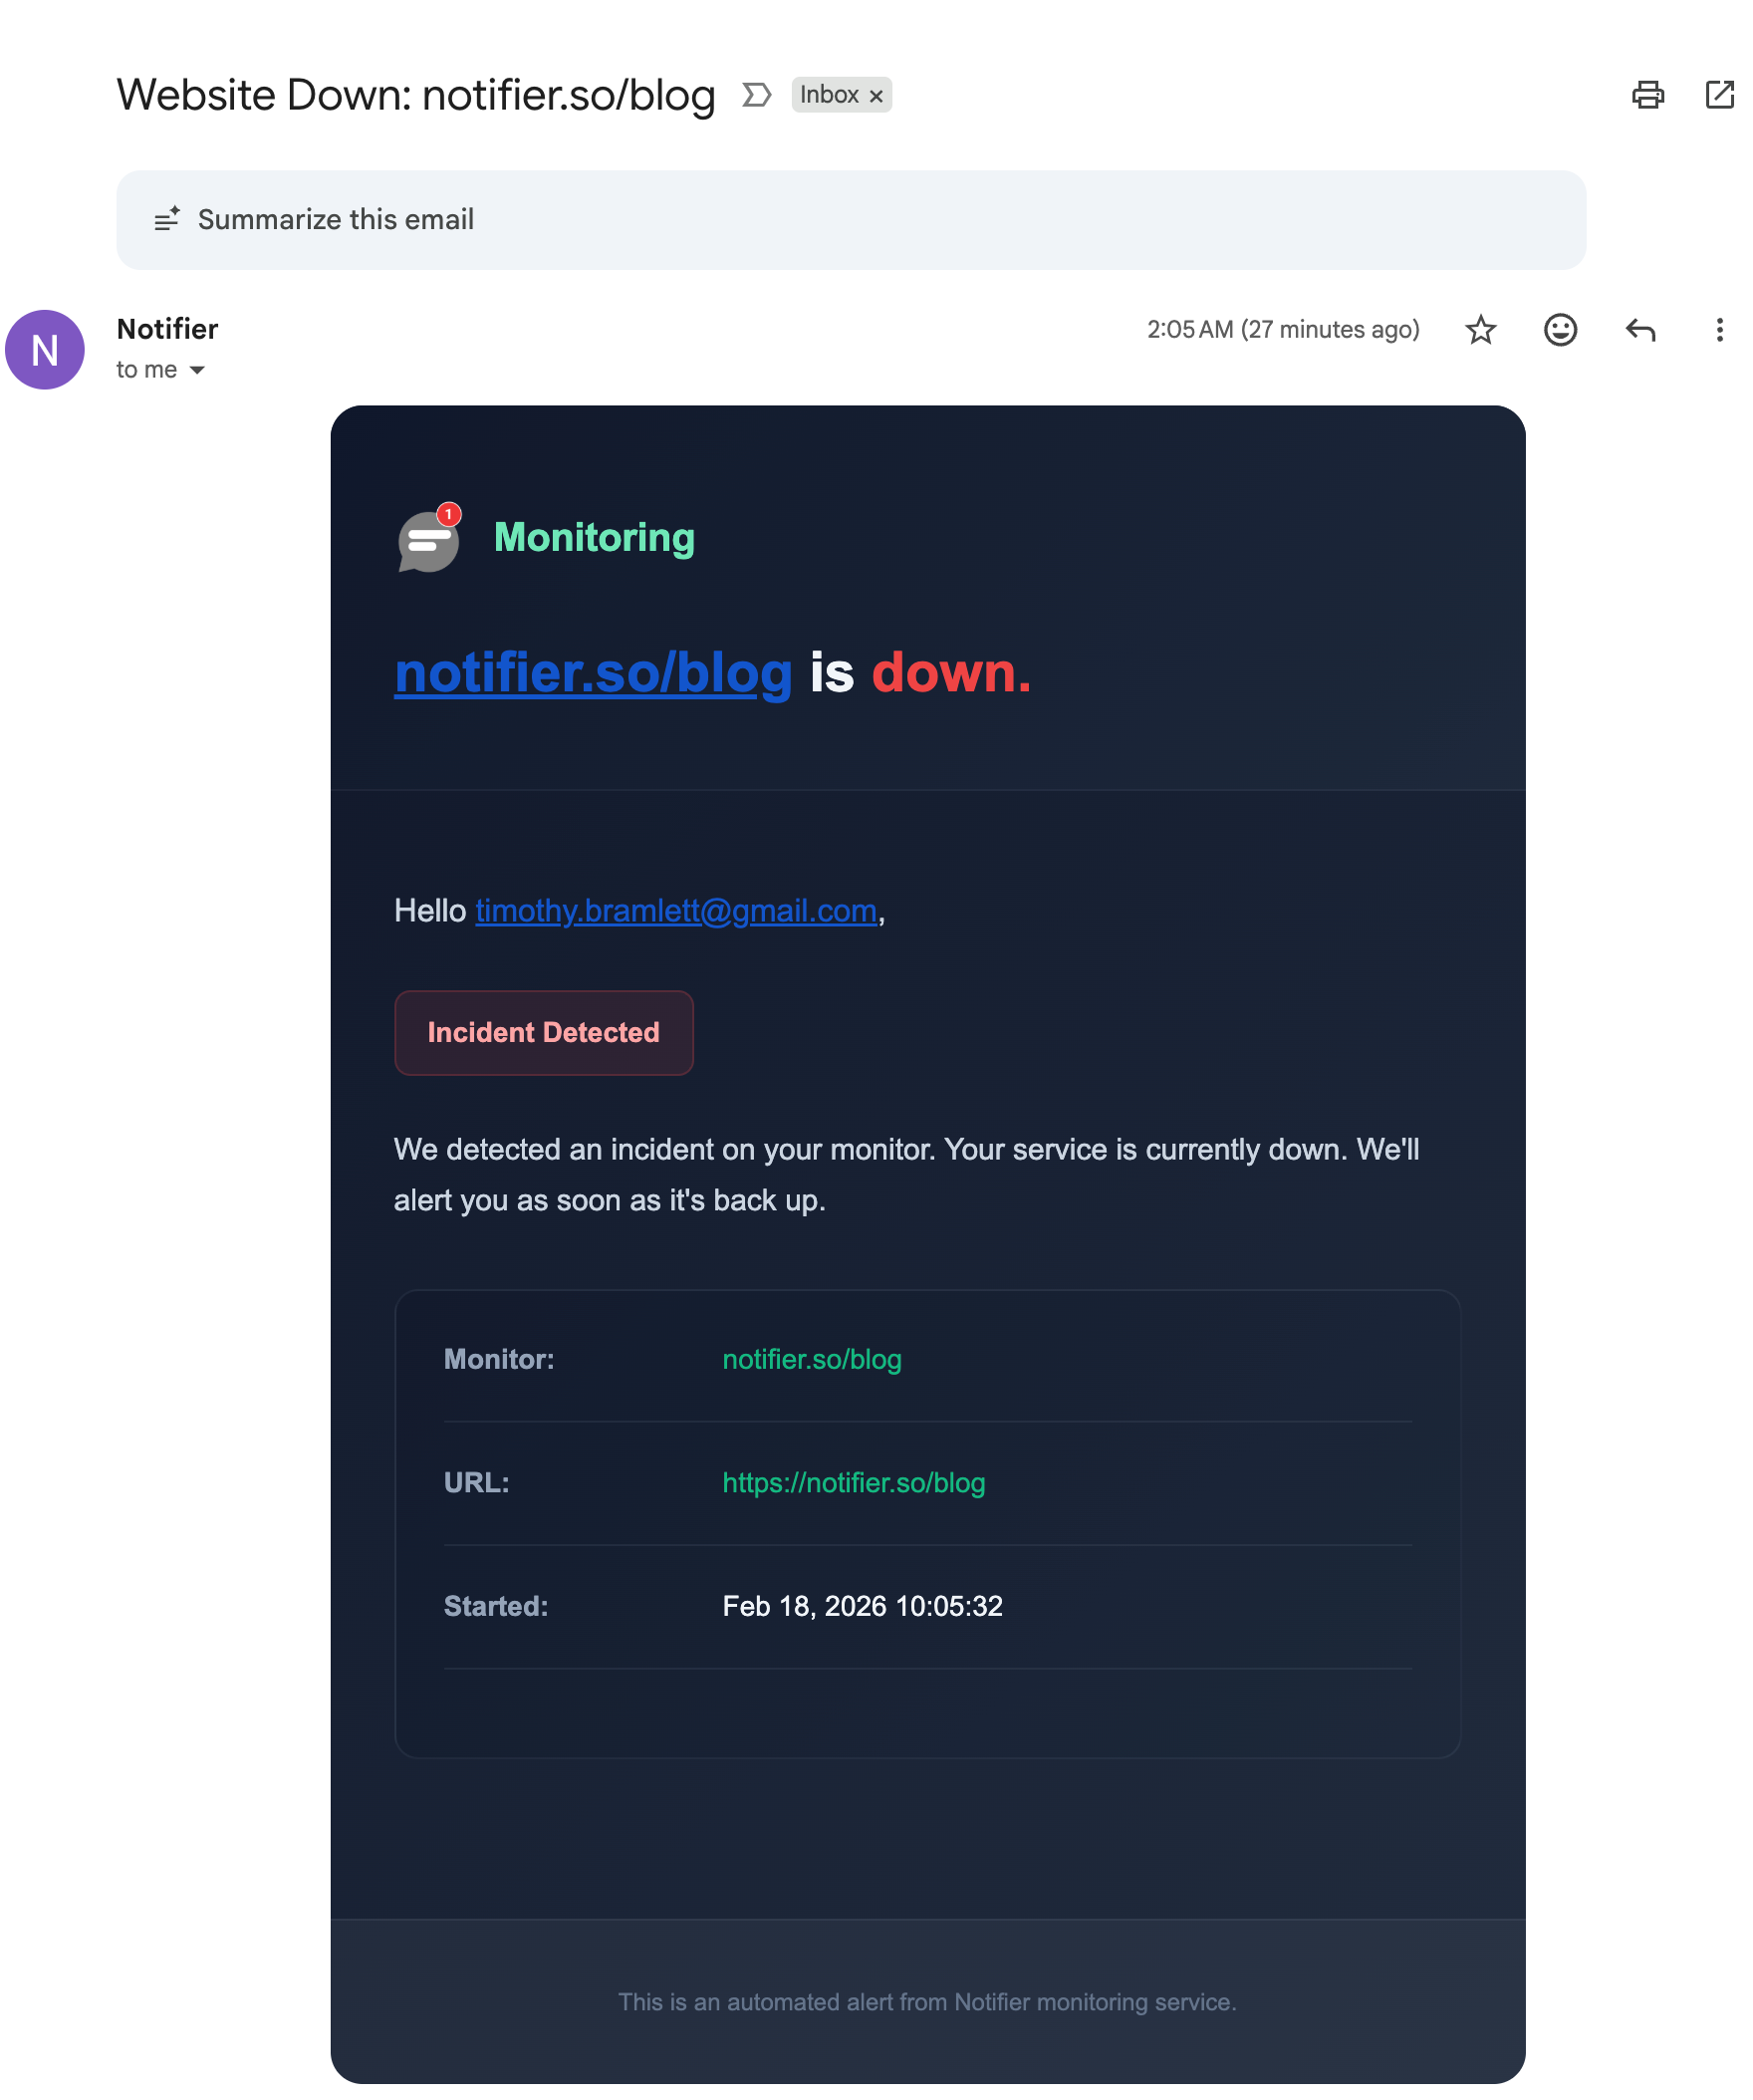
The alert includes the time the incident started, so you know which minute of logs to read.
How the Common Tools Compare
Rate limit problems are short and tied to traffic peaks, so check frequency and alert channels matter most. Here is how the usual options compare on their free plans:
| Tool | Free Plan | SSL Monitoring | Notes |
|---|---|---|---|
| Notifier | 10 monitors, 5 min checks, 5 status pages | Free on every plan | Email, SMS, phone, and Slack alerts on free. Commercial use allowed. Solo is $4/month for 20 monitors at 1 minute. |
| UptimeRobot | 50 monitors, 5 min checks, 1 status page | Included | Free plan is non-commercial only. SMS and voice sold as credits. |
| Better Stack | 10 monitors, 3 min checks, 1 status page | Included | Strong incident management, but pricing is per responder and adds up quickly for a team. |
| StatusCake | 10 monitors, 5 min checks | 1 SSL monitor on free | Status pages are a separate paid product, and SMS uses paid credits. |
| Uptime Kuma | Unlimited, self-hosted | Included | Free and flexible, but running it on the same server means requests come from your own IP, which rate limiters and logs treat differently from real visitors. |
Important: UptimeRobot restricted its free plan to non-commercial use only in October 2024. If the site belongs to a business or a client, that free tier is not an option. Notifier's free tier has no such restriction.
Pricing changes, so verify before committing. Our comparison of free website monitoring tools covers each free tier in detail, and how to set up website monitoring walks through setup in about five minutes. If rate limits are only one of several problems appearing under load, why your website keeps going down covers the patterns behind recurring outages.
Frequently Asked Questions
What does 429 Too Many Requests mean?
It means a rate limiter decided you sent too many requests in a given amount of time and refused the latest one. The server is up and working. The limit may be tied to your IP address, your account, or an API key, and it usually resets after a short wait, often between one and fifteen minutes. The response may include a Retry-After header saying exactly how long to wait.
How do I fix a 429 error as a visitor?
Stop refreshing and wait a few minutes, because every refresh counts against the limit. Then turn off your VPN, since VPN servers share one IP address among many users, close duplicate tabs of the same site, and try an Incognito window to rule out extensions that send background requests. On logged in services the limit is usually tied to your account, so only waiting or upgrading your plan will help.
Why am I getting 429 errors on my own website?
The most common reason is a rate limiter that sees every visitor as the same IP address, because the site sits behind Cloudflare, a load balancer, or a reverse proxy and the real client IP is not being passed through. The next most common is a limit applied to every request, including images, scripts, and AJAX calls, or an Nginx limit_req rule with no burst value. Check the client address in your Nginx error log for limiting requests messages to tell which one it is.
How long does a 429 Too Many Requests error last?
It depends entirely on the rate limit's window. Many website limits reset within a minute, security plugins and firewalls often block for 5 to 60 minutes, and API quotas can reset hourly or daily. If the response includes a Retry-After header, that value is the wait time. Retrying before then usually extends the block.
What is the difference between a 429 and a 503 error?
A 429 says you, specifically, sent too many requests. A 503 says the server cannot handle requests from anyone right now, usually because it is overloaded or down for maintenance. The two overlap in practice: Nginx rate limiting returns 503 by default unless limit_req_status is set to 429, so bursts of 503 errors with no crash can actually be rate limiting.
Does a 429 error hurt SEO?
Brief 429s do not. Google treats a 429 as a sign that it is crawling too fast and slows down. But if Googlebot keeps receiving 429 responses on the same pages for an extended period, those pages can be dropped from the index. Make sure your rate limits are not blocking verified Googlebot requests, and use robots.txt rather than 429 responses to keep crawlers away from pages permanently.
How should my code handle 429 responses from an API?
Wait for the time in the Retry-After header if it is present. If not, retry with exponential backoff, doubling the wait after each attempt up to a cap, and add a small random delay so multiple workers do not retry at the same moment. Longer term, cache responses, use batch endpoints, replace polling with webhooks, and track the RateLimit-Remaining header so you slow down before you reach the limit.
Will uptime monitoring detect 429 errors?
Yes. A 429 is not a successful response, so an HTTP uptime monitor treats it as a failed check and alerts you. Because a monitor sends only one request per check, a 429 on a monitor almost always means your rate limiter or bot protection is catching legitimate traffic too. Notifier checks every 5 minutes on the free plan and every minute on the $4/month Solo plan, with email, SMS, phone call, and Slack alerts and free SSL monitoring.