At a Glance
- •400 Bad Request means the server could not understand the request your browser or client sent, so it refused to process it. The problem is in the request itself, not in the server's code, which is what separates it from a 500 error.
- •As a visitor, the fix that works most often is clearing the cookies for that one site. Cookies only grow, and once they push the request header past the server's limit, every request you send to that site is rejected until the cookies are gone.
- •On a site you own, the three common causes are headers larger than the server's buffer (Nginx allows 8 KB per header line by default), a hostname missing from the application's allowed hosts list, and a plain HTTP request arriving on an HTTPS port.
- •Run curl -v against the failing URL and read the response body. Nginx says "Request Header Or Cookie Too Large", Django returns a bare "Bad Request (400)" for a rejected Host header, and an API usually names the field it could not accept.
- •A monitor sends no cookies, so it catches the configuration 400s that break the site for everyone but not the cookie ones. Notifier is free for 10 monitors with SSL and DNS monitoring included, and paid plans start at $4/month for 1-minute checks.
400 Bad Request is the server telling you it could not make sense of what you sent. Not that it crashed, not that you lack permission, not that the page is missing. The bytes that arrived were malformed, too large, or addressed to a hostname the server does not answer for, so it threw them away before doing any real work.
That makes 400 one of the strangest errors to debug, because it is almost always invisible to the person who owns the site. The most common cause on the visitor side is a single oversized cookie, which means the site works perfectly in your browser and fails in theirs. The most common cause on the server side is a configuration detail that only breaks for one hostname or one kind of request.
This guide covers what a 400 actually means, the visitor fixes that work (and the ones that do not), a one minute diagnosis that identifies which layer rejected the request, the three causes behind nearly every unexpected 400 on a site you run, and how API clients should handle one. If you do not run the site, skip to the visitor section.
What 400 Bad Request Actually Means
HTTP 400 is the generic client error. The specification says the server cannot or will not process the request because of something the client did wrong: malformed syntax, an invalid message framing, or deceptive request routing. Everything in the 4xx range points at the request rather than the server, and 400 is the catch all for requests that fail before any more specific code applies.
In practice, a 400 comes from one of two very different places, and telling them apart is most of the work:
- A transport level 400. Your web server, reverse proxy, or CDN rejected the request while parsing it. The application never ran. Nginx, Apache, IIS, and Cloudflare all do this when headers are too big, the request line is invalid, or the connection is being used in a way they do not allow. The response is a bare, unbranded error page.
- An application level 400. Your code received the request, looked at it, and decided it was invalid. A missing required field, unparseable JSON, a hostname not in the allowed list, or a query parameter that should have been a number. The response usually contains a message written by your framework or your own validation code.
A transport level 400 tends to affect a specific set of visitors, such as everyone with a large cookie, and leaves no trace in your application logs at all. An application level 400 shows up in your logs with a reason attached. The diagnosis section below shows how to tell which one you have in a single command.
400 Compared to the Errors It Gets Confused With
Several errors look like a 400 from the outside, and several servers send a 400 when a more specific code exists. This table is the fastest way to confirm you are debugging the right thing:
| Code | What It Means | How It Differs From 400 |
|---|---|---|
| 400 | The request itself was malformed or unacceptable | The server could not even parse or route what you sent |
| 401 | Authentication required or credentials invalid | The request was understood, you just are not logged in |
| 403 | Understood and refused | A firewall, permission, or rule blocked a valid request |
| 404 | The URL is valid but nothing lives there | Routing worked, the resource does not exist |
| 413 | Request body too large | Too much uploaded data, not oversized headers |
| 414 | URL too long | The request line exceeded the buffer, not the headers |
| 431 | Request header fields too large | The correct code for oversized headers, but most servers still send 400 |
| 429 | Too many requests | The request was fine, you just sent too many of them |
| 500 | Server error | Your request was valid, the server broke handling it |
The 431 trap:
HTTP 431 Request Header Fields Too Large exists precisely for oversized cookies and headers, but almost nothing sends it. Nginx, Apache, and IIS all return 400 instead. So if you are searching for the cause of a 400, "header too large" belongs at the top of your list even though a dedicated status code for it exists.
If the page you are looking at is actually a 403 or a 429, we have dedicated guides for fixing 403 Forbidden and fixing 429 Too Many Requests.
If You Are a Visitor: How to Fix 400 Bad Request
When one site returns a 400 and every other site works, the problem is almost always something your browser is attaching to the request. Work through these in order, because the first one fixes the large majority of cases.
1. Clear the Cookies for That One Site
This is the fix. Cookies accumulate, and once the total cookie header for a domain grows past the server's limit, every single request you send to that site is rejected before it reaches the application. Clearing your entire browser history is not necessary and logs you out of everything, so target the one domain:
- Chrome and Edge: Click the icon to the left of the address bar, choose Cookies and site data, then Manage on device site data, and delete the entries for that domain. Or open
chrome://settings/content/alland search for the domain. - Firefox: Settings, Privacy and Security, Cookies and Site Data, Manage Data, search for the domain, then Remove Selected.
- Safari: Settings, Privacy, Manage Website Data, search for the domain, then Remove.
Reload the page afterwards. You will be logged out of that one site, which is expected. If the 400 disappears and comes back a few days later, the site has a cookie that grows on every visit, and only the site owner can fix that properly.
2. Look Closely at the URL
A URL containing a raw space, a stray percent sign, or characters pasted from a document with smart quotes will be rejected outright. If you copied the link from an email, a chat message, or a PDF, retype it or copy it again from the source. A URL that ends mid word, or that contains a doubled up %25, has been mangled somewhere in transit.
3. Try an Incognito or Private Window
A private window sends no cookies and loads no extensions. If the page works there, you have confirmed it is something in your profile: either the cookies from step 1, or an extension injecting headers. Disable extensions one at a time, starting with anything that touches privacy, VPNs, or request headers.
4. Check the Size of Your Upload
If the 400 appears only when you submit a form with a file attached, the file is likely over the site's limit. The correct code for this is 413, but plenty of servers and frameworks answer with a 400. Try a smaller file to confirm.
5. Flush Your DNS Cache
Rarely, a stale DNS entry sends you to a server that does not answer for that hostname, and it responds with a 400. Flushing costs nothing:
# Windows
ipconfig /flushdns

# macOS
sudo dscacheutil -flushcache; sudo killall -HUP mDNSResponder

# Linux (systemd)
sudo resolvectl flush-caches
What will not help: restarting your router, reinstalling your browser, switching to Google DNS, disabling your antivirus, or trying again in an hour. A 400 is generated the instant your request arrives. If clearing that site's cookies and using a private window both fail, the problem is on the server and no amount of local troubleshooting will change it. Check whether others can reach it using the methods in our guide to checking if a site is down for everyone or just you.
Diagnose It: Find Out Which Layer Rejected the Request
A 400 page in a browser hides the useful part. Run the request from a terminal and read the raw response instead:
curl -v https://example.com/the-failing-path 2>&1 | tail -40The response body names the culprit far more often than people expect. Match what you see against this table:
| What the Response Says | Who Rejected It | Go To |
|---|---|---|
| Request Header Or Cookie Too Large | Nginx, before your app ran | Cause 1 |
| The plain HTTP request was sent to HTTPS port | Nginx, scheme and port mismatch | Cause 3 |
| HTTP Error 400. The size of the request headers is too long | IIS or http.sys on Windows | Cause 1 |
| Bad Request (400) with no other detail | Django rejecting the Host header | Cause 3 |
| A Cloudflare branded error page | Cloudflare, before it reached your origin | Cause 1 |
| JSON naming a field or a parse error | Your application or API framework | API section |
| curl fails before any status code | TLS or DNS, not a 400 at all | SSL guide |
Read the Nginx Error Log
Transport level 400s are logged in the error log, not the access log, and the message states the exact reason:
sudo grep -E "too long header line|invalid request|too large|Host header" /var/log/nginx/error.log | tail -20Typical lines and what each one means:
client sent too long header linemeans headers or cookies exceeded the buffer.client sent invalid request while reading client request linemeans the URL or method was malformed.client sent invalid Host headermeans the hostname was junk or missing.
Count the 400s in Your Access Log
To see whether this is one confused visitor or a real pattern, group by URL and then by hour:
# Which paths return 400 most often
awk '$9 == 400 {print $7}' /var/log/nginx/access.log | sort | uniq -c | sort -rn | head -20

# When they started
awk '$9 == 400 {print substr($4, 2, 14)}' /var/log/nginx/access.log | uniq -c

# How many distinct visitors are affected
awk '$9 == 400 {print $1}' /var/log/nginx/access.log | sort -u | wc -l
Many distinct IPs hitting 400 on a single path points to a broken link or a bad client side request your own code generates. Many distinct IPs across all paths points to a header or configuration problem. A sharp start time lines up with your last deploy or DNS change.
Cause 1: Request Headers or Cookies Too Large
This is the single most common source of unexplained 400s on a working site, and the reason the error is so hard to reproduce. Every web server allocates a fixed buffer for incoming request headers. Go past it and the request is discarded during parsing, before any routing, logging, or application code runs.
Cookies are usually what fills that buffer, because they are sent with every request and they only ever grow. Analytics libraries, A/B testing tools, consent managers, ad platforms, and single sign on tokens each add their own. A JWT with a few claims in it can be over 1 KB by itself. Store session data in a cookie instead of server side and the total climbs fast.
The Default Limits
| Server | Default Header Limit | Setting |
|---|---|---|
| Nginx | 8 KB per header line | large_client_header_buffers |
| Apache | 8190 bytes per header | LimitRequestFieldSize |
| IIS | 16 KB total request | MaxRequestBytes, MaxFieldLength |
| Tomcat | 8 KB total headers | maxHttpHeaderSize |
| HAProxy | 16 KB buffer | tune.bufsize |
| Cloudflare | About 32 KB total, 16 KB per header | Not configurable |
Note the stack effect. If you run Nginx behind Cloudflare in front of Tomcat, the smallest limit in the chain wins, and the error page you see tells you which link broke.
Confirm It in Ten Seconds
Send the same request twice, once clean and once with a deliberately oversized cookie:
# Clean request
curl -s -o /dev/null -w "clean: %{http_code}\n" https://example.com/

# Same request with a 12 KB cookie attached
BLOAT=$(head -c 12000 /dev/zero | tr '\0' 'x')
curl -s -o /dev/null -w "bloated: %{http_code}\n" -H "Cookie: junk=$BLOAT" https://example.com/
If the clean request returns 200 and the bloated one returns 400, you have confirmed the cause and found your limit. To see how close real visitors are to it, open your site and run document.cookie.length in the browser console. Anything over about 4000 characters deserves attention, and anything approaching 8000 is already breaking for some people.
Raise the Limit
Raising the buffer is the immediate fix. For Nginx, in the http block of /etc/nginx/nginx.conf:
http {
    client_header_buffer_size   4k;
    large_client_header_buffers 8 32k;
}
sudo nginx -t && sudo systemctl reload nginxWhy the setting sometimes appears to do nothing:
On an HTTPS connection, Nginx has to read the request before it knows which server block to use, so it applies the buffer settings from the default server for that address and port. Putting large_client_header_buffers in one virtual host while a different server block is the default for port 443 means your change is ignored. Set it in the http block so it applies everywhere.
The equivalents elsewhere:
# Apache (httpd.conf)
LimitRequestFieldSize 32768
LimitRequestFields 100

# Tomcat (server.xml connector)
maxHttpHeaderSize="32768"

# HAProxy (global section)
tune.bufsize 32768
Remember to raise the limit on every hop. Raising it on Nginx while the app server behind it still uses an 8 KB buffer just moves the 400 one layer back.
Then Fix the Real Problem
A bigger buffer buys you time, not a solution. Cookies that grow will eventually pass any limit you set, so shrink what you send:
- Move session data server side. Store an identifier in the cookie and keep the data in Redis or your database. A session cookie should be tens of bytes, not kilobytes.
- Scope cookies with Path and Domain. A cookie set on
.example.comis sent to every subdomain and every asset request. Set it on the exact host that needs it. - Serve static assets from a cookieless domain. Every image and script request currently carries the full cookie payload for no reason.
- Set an expiry on everything. Cookies with no Max-Age linger until the browser is closed or forever. Audit what your tag manager is writing.
- Delete the stale ones. If a past version of your app wrote cookies you no longer read, send Set-Cookie headers that expire them so returning visitors are cleaned up automatically.
Cause 2: Malformed URLs and Bad Encoding
The request line is the first thing a server parses, and it is unforgiving. Anything that is not valid HTTP syntax is rejected immediately with a 400 and an invalid request line in the error log.
What Breaks a URL
- Unencoded spaces and special characters. A space must be
%20. Curly braces, angle brackets, pipes, and backticks all need encoding too. - Invalid percent escapes. A percent sign must be followed by two hexadecimal digits. A bare
%, or something like%zz, is a syntax error. - Double encoding. A value encoded twice turns a space into
%2520. This usually produces a 404, but strict frameworks reject it with a 400. - Control characters and smart quotes. Text pasted from a word processor carries curly quotes and non breaking spaces that look identical to the plain versions and are not valid in a URL.
- Absurdly long URLs. Past the buffer you get a 414, but some proxies answer with a 400 instead. Filter and faceted search pages are the usual offenders.
Encode It Properly
If your own code builds URLs, use the language's encoder rather than string concatenation:
# Python
python3 -c "import urllib.parse; print(urllib.parse.quote('report 2026/Q1.pdf'))"
# report%202026/Q1.pdf

# JavaScript
encodeURIComponent('report 2026/Q1.pdf')
// 'report%202026%2FQ1.pdf'

# curl, which encodes the value for you
curl -G --data-urlencode "q=report 2026 Q1" https://example.com/search
Then find where the bad URLs are coming from. If your access log shows many distinct visitors hitting 400 on the same path, something on your site is generating the link: a template that interpolates an unescaped value, a redirect that concatenates a query string twice, or a marketing campaign URL with a broken parameter. A 400 you generated yourself is far more common than a visitor typing something strange.
Cause 3: Host Header and Scheme Mismatches
This category is the one that takes down a whole site at once, usually minutes after a deploy, a DNS change, or adding a new domain. The request is perfectly well formed. The server just does not accept it for that hostname or on that port.
Plain HTTP Sent to an HTTPS Port
If your response body reads The plain HTTP request was sent to HTTPS port, an unencrypted request arrived on a port configured for TLS. It happens when a load balancer terminates TLS and then forwards over plain HTTP to a port that expects encryption, or when a single Nginx server block listens on both 80 and 443 with ssl enabled.
The fix is to give each port its own server block:
server {
    listen 80;
    server_name example.com www.example.com;
    return 301 https://$host$request_uri;
}

server {
    listen 443 ssl;
    http2 on;
    server_name example.com www.example.com;

    ssl_certificate     /etc/letsencrypt/live/example.com/fullchain.pem;
    ssl_certificate_key /etc/letsencrypt/live/example.com/privkey.pem;

    # Redirect anyone who reaches this port over plain HTTP
    error_page 497 =301 https://$host$request_uri;
}
Nginx uses the internal code 497 for exactly this situation, and mapping it to a redirect turns a confusing 400 into the behaviour visitors expect.
The Hostname Is Not in the Allowed List
Modern frameworks refuse requests whose Host header they do not recognise, as a defence against cache poisoning and password reset link forgery. Django is the most commonly hit, and it answers with a bare Bad Request (400) page that says nothing about why:
# settings.py
ALLOWED_HOSTS = [
    'example.com',
    'www.example.com',
    '.example.com',   # matches every subdomain
]
The giveaway is in your application log: Invalid HTTP_HOST header followed by the hostname it saw. ASP.NET Core's host filtering middleware behaves the same way and also returns 400. Ruby on Rails returns 403 rather than 400 for a blocked host, which is covered in our 403 Forbidden guide.
Three situations trigger this after everything had been working:
- You added a new domain or subdomain and updated DNS but not the application config.
- A load balancer health check connects by IP address, so the Host header is an IP that is not in the list.
- A proxy is rewriting the Host header to its own internal name instead of passing the original through.
The Proxy Is Rewriting the Host
By default, Nginx sets the Host header on proxied requests to the value of proxy_pass, which is often 127.0.0.1. Your application then sees a hostname it has never heard of. Pass the real one through:
location / {
    proxy_pass http://127.0.0.1:8000;
    proxy_set_header Host              $host;
    proxy_set_header X-Real-IP         $remote_addr;
    proxy_set_header X-Forwarded-For   $proxy_add_x_forwarded_for;
    proxy_set_header X-Forwarded-Proto $scheme;
}
This same misconfiguration is behind several other errors, including rate limiters that treat every visitor as one IP address. If you are also seeing 429s, our 429 Too Many Requests guide covers the proxy header side of it in depth. If a 400 is one of several errors that keep appearing, what causes website downtime maps the common failure patterns.
Getting a 400 From an API You Are Calling
When a 400 comes from an API, the response body almost always explains the problem, and almost every developer throws it away. The first rule is to print it:
import requests

resp = requests.post(url, json=payload, headers=headers)
if not resp.ok:
    # The useful part is here, not in the status code
    print(resp.status_code, resp.text)
resp.raise_for_status()
The Usual Suspects
- Invalid JSON. A trailing comma, single quotes instead of double, an unescaped newline inside a string, or a Python dict printed with
str()instead of serialised withjson.dumps(). Validate the payload first withjq . payload.json. - Missing or wrong Content-Type. Sending a JSON body without
Content-Type: application/jsonmakes most frameworks fail to parse it, then reject the request as having no body at all. - Wrong types in the payload. Sending
"quantity": "5"where an integer is expected, or a date in a format the API does not accept. - Missing required fields. Especially after an API version bump that made an optional field mandatory.
- An expired or malformed token. A truncated bearer token can produce a 400 rather than a 401, because the header cannot be parsed at all.
Reproduce It With curl
# Save the exact payload your code sends, then replay it
curl -v -X POST https://api.example.com/v1/orders \
  -H "Content-Type: application/json" \
  -H "Authorization: Bearer $API_TOKEN" \
  --data-binary @payload.json
Using --data-binary rather than -d matters, because -d strips newlines and can make a broken payload look valid.
Never retry a 400:
A 429 or a 503 is worth retrying, because the same request may succeed later. A 400 will never succeed, because the request itself is wrong. Retry logic that treats every non 200 the same way will hammer the API with a request that can only fail, and may get your key rate limited or suspended. Retry on 408, 429, and 5xx. Log and stop on 400.
For monitoring the health of an API rather than debugging one call, our guide to monitoring an API endpoint covers status codes, response body validation, and authenticated checks.
Catching 400 Errors Before Your Visitors Report Them
The 400 is the most under reported error on the web. It produces an unstyled page with no explanation, so visitors assume the site is broken and leave rather than contacting you. And because the request is rejected during parsing, a transport level 400 often never appears in your application logs at all. You can spend a week not knowing.
An external uptime monitor sends a real HTTP request from outside your network on a fixed schedule and treats anything other than a success code as a failed check. The configuration 400s in Cause 3 are exactly the kind that break the site for everyone the moment a deploy lands, and those show up in a monitor within minutes.
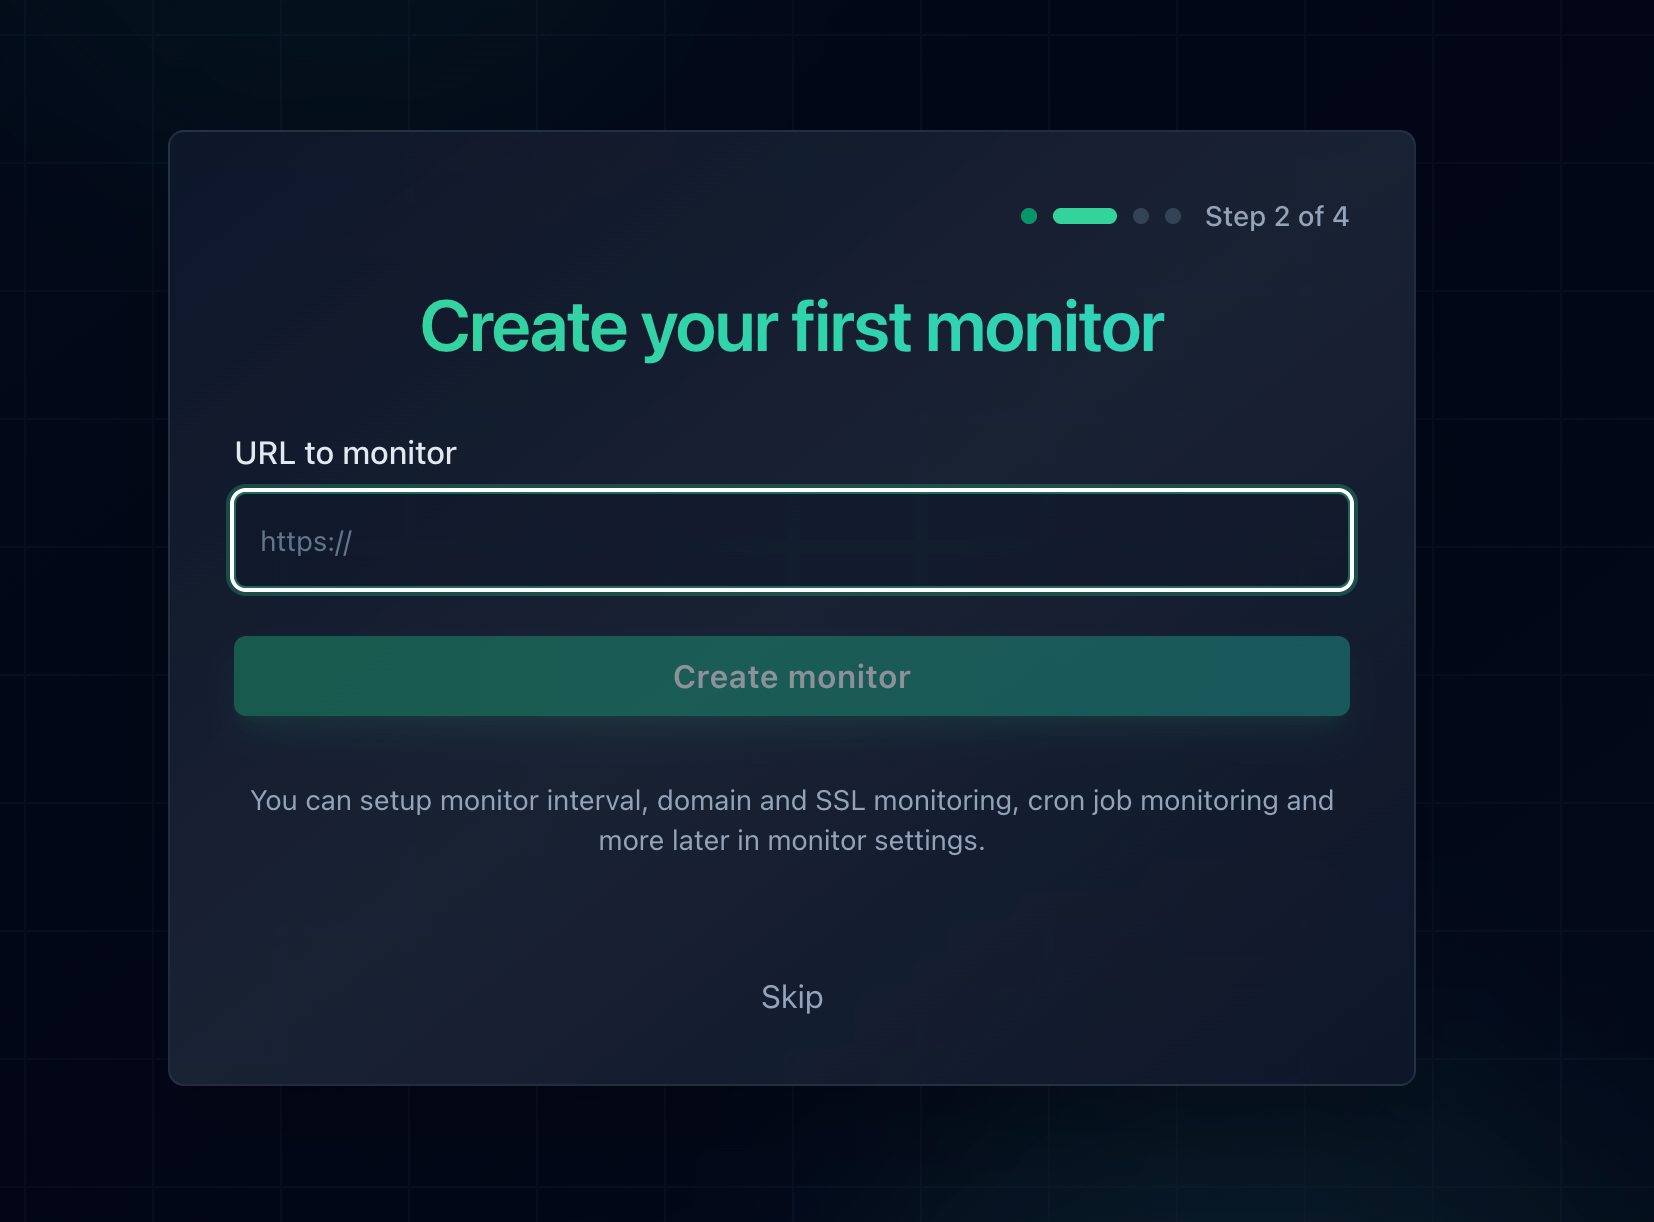
Add the URL and every check sends a real request that has to parse cleanly on your server.
Where monitoring has a blind spot, and what to do about it:
A monitor sends no cookies, so a header too large 400 affecting your returning visitors will never appear in your checks. That half of the problem lives in your access logs, so pair monitoring with a weekly look at 400 counts using the awk commands above. Monitoring catches the outages that hit everyone. Log review catches the ones that hit the people who visit you most often.
Monitor more than the homepage. A cached homepage can be served by your CDN without ever touching the origin that is rejecting requests, while your login page, checkout, or API fails behind it. Add a monitor for every hostname you own too, since a missing entry in an allowed hosts list breaks exactly one subdomain and leaves the rest healthy.
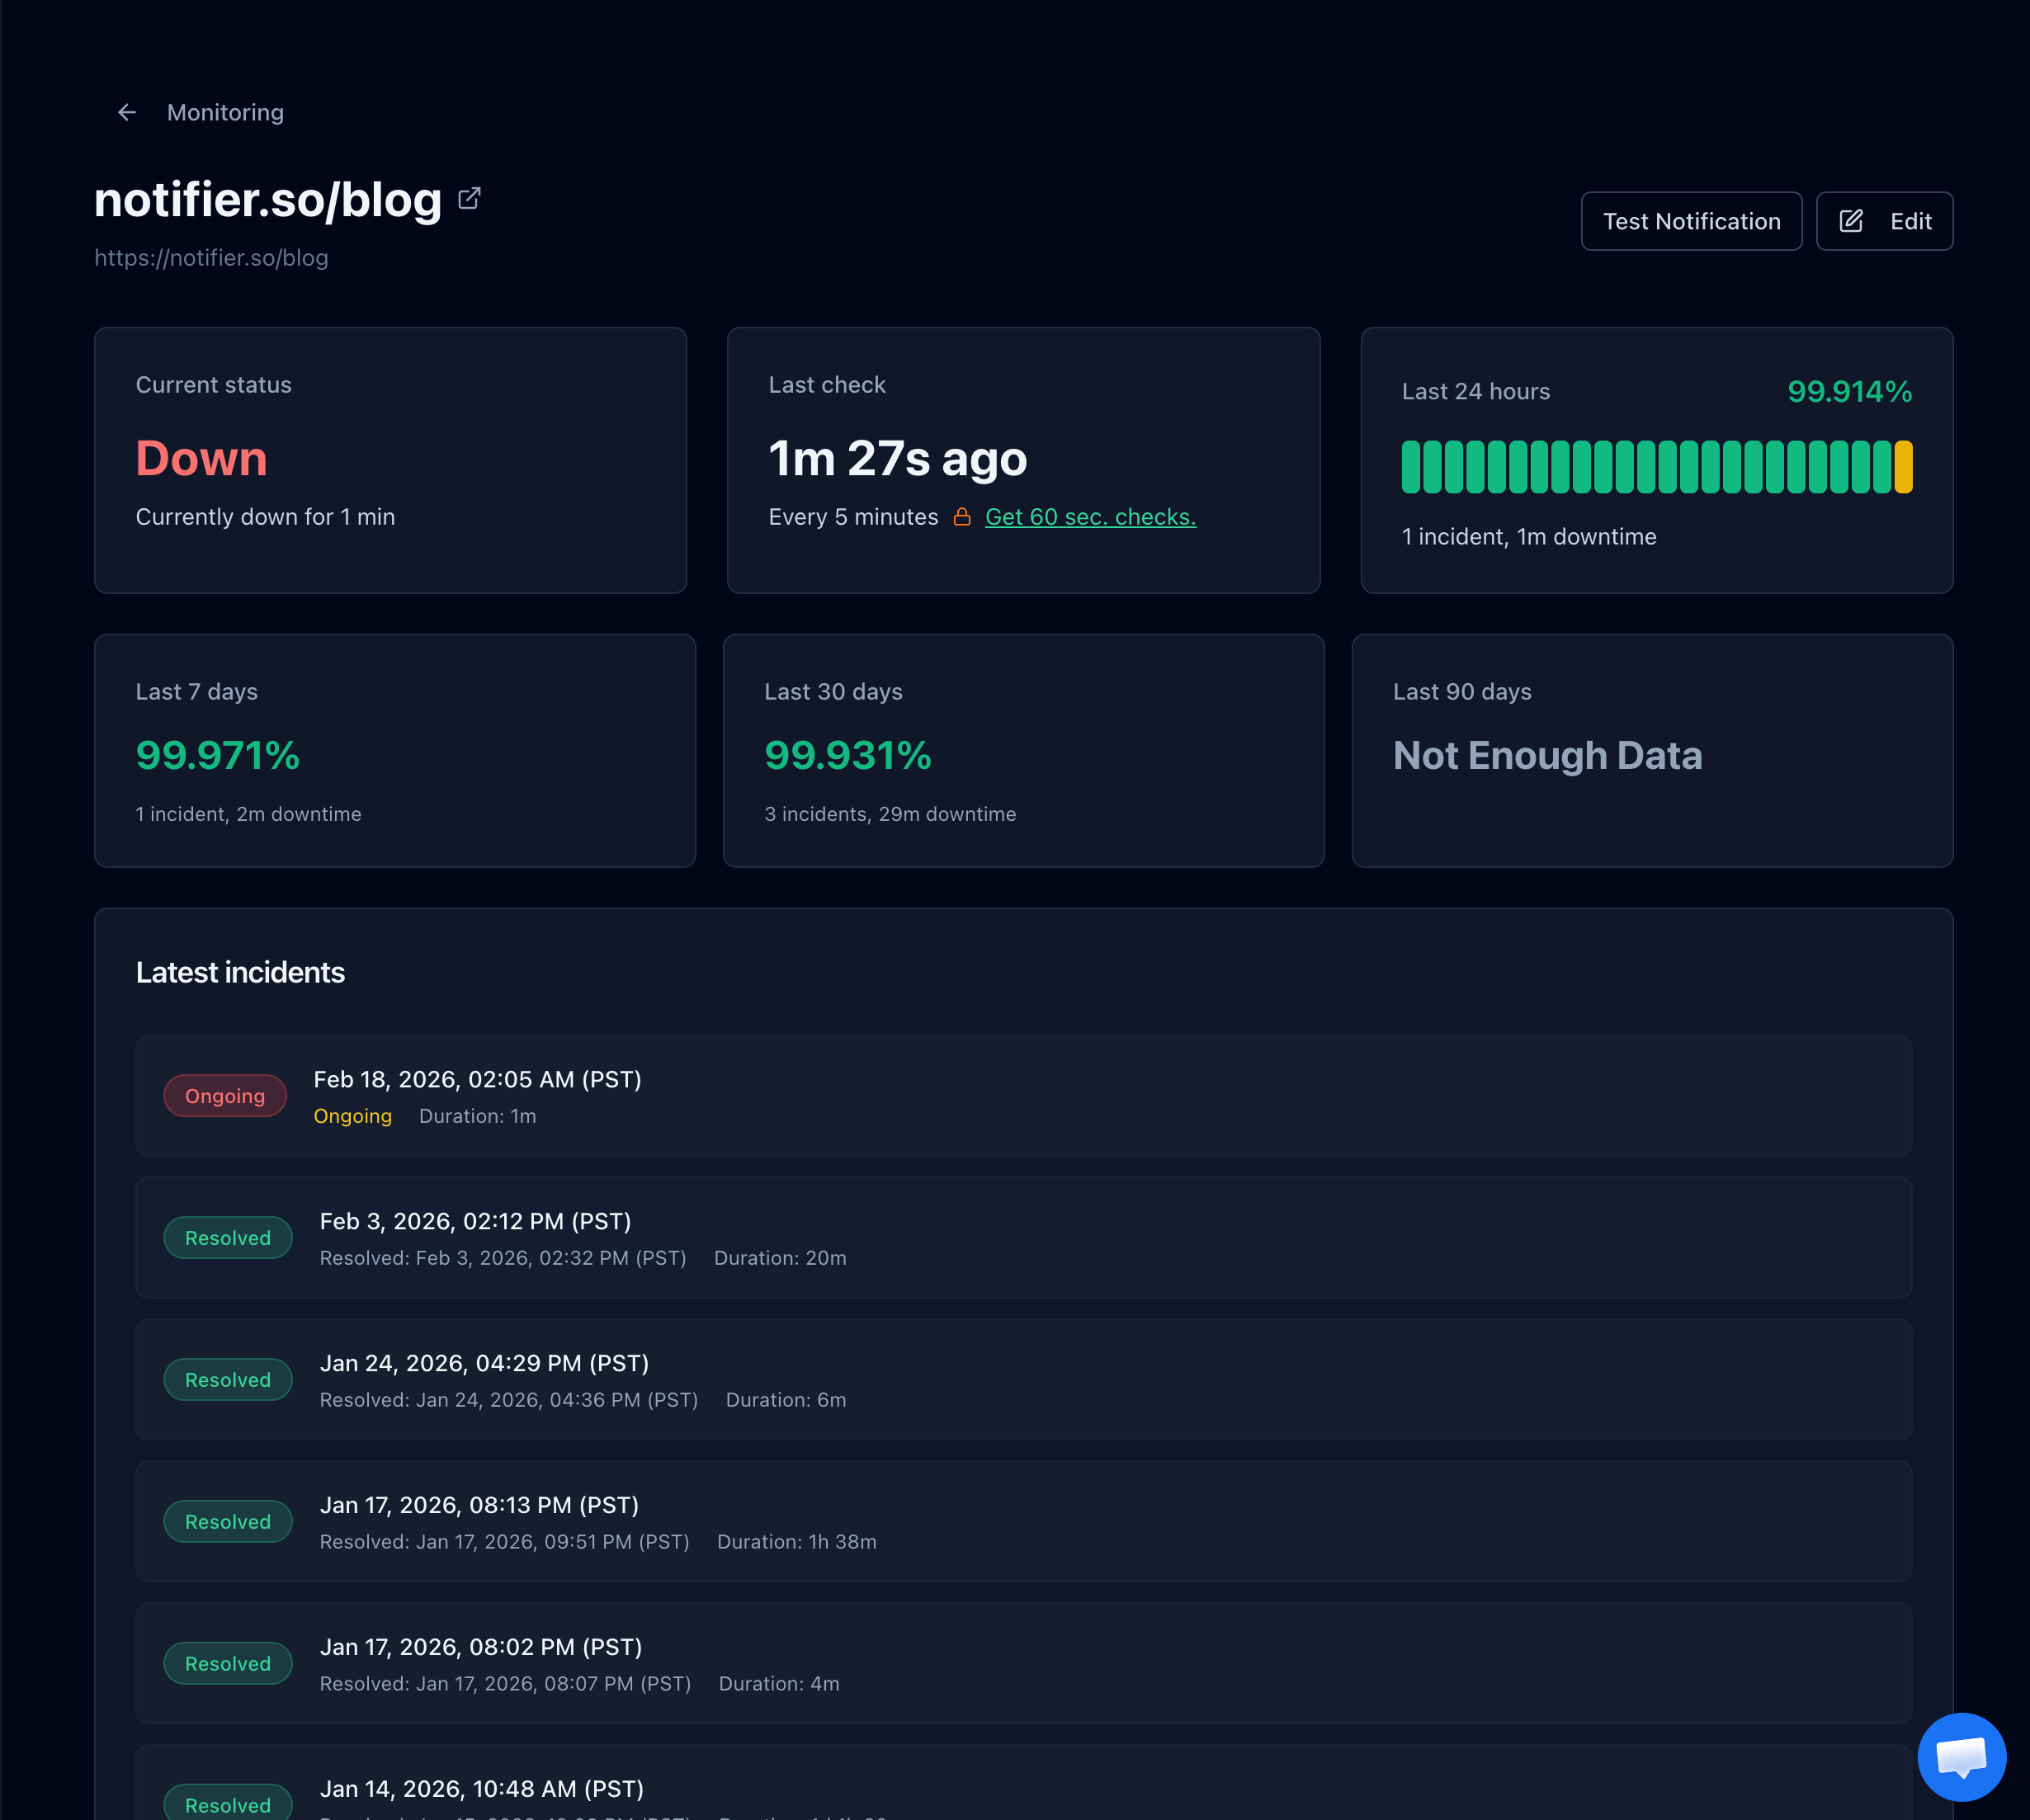
The incident history gives you the exact minute checks began failing, which is the minute of logs to read.
Get the Alert Where You Will See It
Notifier sends email, SMS, phone call, and Slack alerts on every plan, including the free tier, plus a recovery alert when checks pass again. SSL certificate and DNS monitoring are included free on every plan as well, so a certificate quietly expiring on the same site does not become the next outage. If you need a hand interpreting what a check is returning, the support team usually replies within minutes through the chat widget or support@notifier.so.
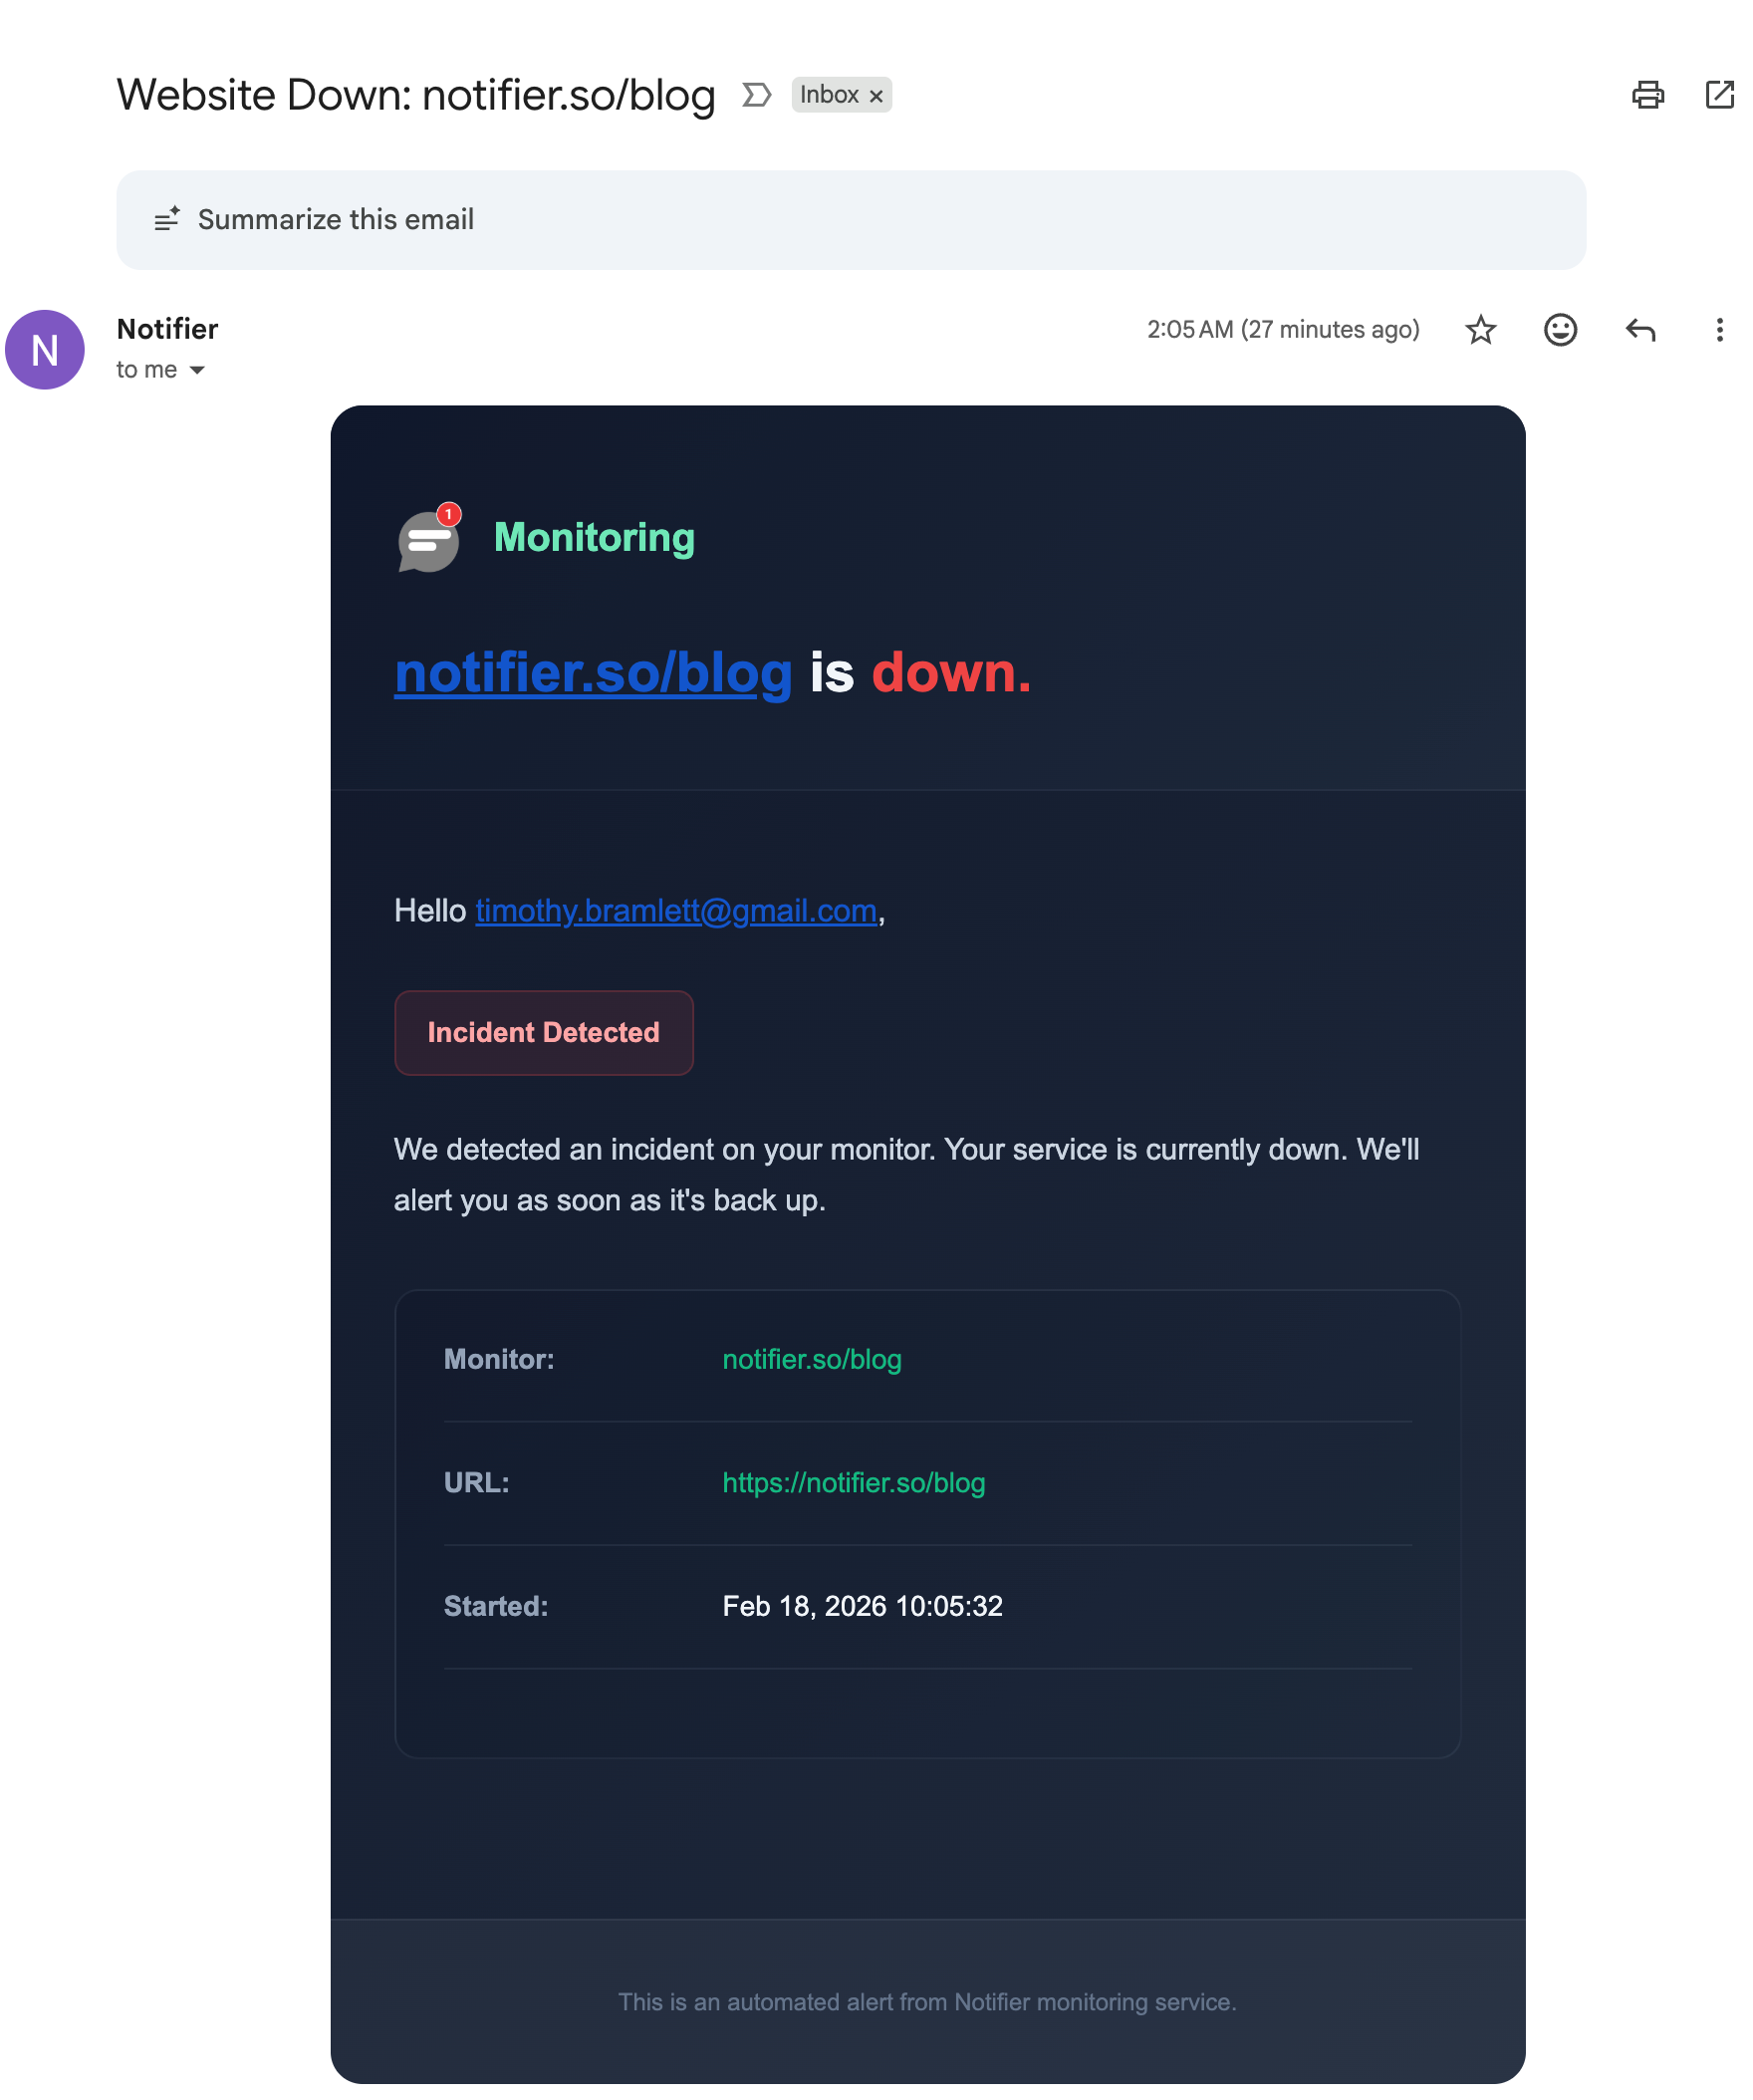
The alert names the monitor and the time the incident started.
A Note on Search Rankings
Google treats a 400 as a client error and will not retry it patiently the way it does a 503. A URL that keeps returning 400 to Googlebot gets dropped from the index, and unlike a 429 there is no built in assumption that the situation is temporary. If a configuration change starts returning 400 for your canonical hostname, the traffic loss compounds for as long as it goes unnoticed. That is the strongest argument for monitoring every public hostname rather than just the one you happen to have open in a tab.
How the Common Tools Compare
A 400 caused by a bad deploy is fixed in minutes once you know, so check frequency and alert channels are what matter. Here is how the usual options compare on their free plans:
| Tool | Free Plan | SSL Monitoring | Notes |
|---|---|---|---|
| Notifier | 10 monitors, 5 min checks, 5 status pages | Free on every plan | Email, SMS, phone, and Slack alerts on free. Commercial use allowed. Solo is $4/month for 20 monitors at 1 minute. |
| UptimeRobot | 50 monitors, 5 min checks, 1 status page | Included | Free plan is non-commercial only. SMS and voice sold as credits. |
| Better Stack | 10 monitors, 3 min checks, 1 status page | Included | Strong incident management, but pricing is per responder and adds up quickly for a team. |
| StatusCake | 10 monitors, 5 min checks | 1 SSL monitor on free | Status pages are a separate paid product, and SMS uses paid credits. |
| Uptime Kuma | Unlimited, self-hosted | Included | Free and flexible, but you have to host and maintain it, and it cannot tell you your server is unreachable if it runs on that server. |
Important: UptimeRobot restricted its free plan to non-commercial use only in October 2024. If the site belongs to a business or a client, that free tier is not an option. Notifier's free tier has no such restriction.
Pricing changes, so verify before committing. Our comparison of free website monitoring tools covers each free tier in detail, and how to set up website monitoring walks through setup in about five minutes. If 400s are one of several errors that keep surfacing, why your website keeps going down covers the patterns behind recurring problems.
Frequently Asked Questions
What does 400 Bad Request mean?
It means the server could not understand the request your browser or client sent, so it refused to process it. The problem is in the request itself rather than in the server's code, which is what separates a 400 from a 500 error. Common reasons are headers or cookies that are too large, a URL containing invalid characters, or a hostname the server does not answer for.
How do I fix a 400 Bad Request error in Chrome?
Clear the cookies for that one site first, using the icon to the left of the address bar or by searching for the domain at chrome://settings/content/all. Then reload the page. If that does not work, check the URL for spaces or characters copied from a document, and open the page in an Incognito window to rule out browser extensions. There is no need to clear your entire history or reinstall the browser.
Why does clearing cookies fix a 400 Bad Request?
Every web server sets a size limit for incoming request headers, commonly 8 KB. Cookies are sent with every request and only grow as analytics, consent, and session tools add their own. Once the total passes the limit, the server discards the request while parsing it and returns a 400 before any application code runs. Deleting the cookies for that domain shrinks the header back under the limit immediately.
What does "400 Bad Request: Request Header Or Cookie Too Large" mean?
That is Nginx telling you a header line exceeded its buffer, which defaults to 8 KB. Visitors can fix it by clearing that site's cookies. Site owners should raise large_client_header_buffers in the http block of nginx.conf, reload Nginx, and then reduce what the site stores in cookies, because a bigger buffer only delays the problem if cookies keep growing.
What is the difference between a 400 and a 403 error?
A 400 means the server could not parse or route your request at all. A 403 means the server understood the request perfectly and refused it anyway, usually because of a permission, a firewall rule, or a security plugin. Put simply, a 400 is a syntax problem and a 403 is a policy decision.
Is a 400 Bad Request my fault or the website's fault?
It can be either. If only one site fails and clearing its cookies fixes it, the trigger was on your side but the underlying cause is the site sending oversized cookies. If clearing cookies and using a private window both fail, the problem is on the server, typically a hostname missing from its allowed list, a plain HTTP request arriving on an HTTPS port, or a proxy rewriting headers.
Does a 400 error hurt SEO?
Yes, if it persists. Google treats 400 as a client error and does not assume it is temporary the way it does with a 429 or a 503, so URLs that keep returning 400 to Googlebot get dropped from the index. A configuration change that starts returning 400 for a canonical hostname loses traffic for as long as it goes unnoticed, which is why monitoring every public hostname matters.
Will uptime monitoring catch 400 errors?
It catches the ones that affect everyone, such as a hostname missing from an allowed hosts list or a plain HTTP request hitting an HTTPS port, because a 400 counts as a failed check and triggers an alert. It will not catch a cookie too large 400, since monitors send no cookies, so review the 400 counts in your access log as well. Notifier checks every 5 minutes on the free plan and every minute on the $4/month Solo plan, with email, SMS, phone call, and Slack alerts and free SSL monitoring.