Your server went down at 3am. By the time you woke up, it had been offline for six hours. Customers couldn't access your service. Support tickets piled up. Revenue was lost. This is what happens without proper server downtime detection.
Server downtime detection is the process of automatically identifying when your server becomes unavailable or unresponsive. Whether you need network downtime analysis across multiple services or simple uptime checks on a single website, the right setup lets you know about problems within minutes (or seconds) and start fixing them before most users even notice.
Why Server Downtime Detection Matters
The cost of downtime varies by business, but the pattern is consistent: the longer you're down, the more it hurts.
- Lost revenue: If your site generates sales, every minute of downtime is money gone
- Customer trust: Users who encounter errors may not come back
- SEO impact: Search engines notice when your site is unreliable
- Support burden: Without proactive detection, you learn about problems from angry customers
- Cascading failures: Without network downtime analysis, a single failed service can take down dependent systems before anyone reacts
The goal of downtime detection is simple: know about problems before your customers do.
Server Downtime Detection Methods
There are several approaches to detecting when a server goes down. Each has trade-offs, and many teams use a combination for comprehensive network downtime analysis.
1. External Monitoring
External monitoring means a service outside your infrastructure checks whether your server is responding. This is the most reliable method because it catches problems that affect your users, including network issues, DNS failures, SSL certificate problems, and complete server crashes.
How it works: A monitoring service sends HTTP requests to your server at regular intervals (every 30 seconds, 1 minute, 5 minutes, etc.). If your server doesn't respond with the expected status code, the service marks it as down and sends you an alert.
This is what services like Notifier, Pingdom, and UptimeRobot do. It's the simplest and most common approach because you don't need to install anything on your server. Notifier also includes free SSL certificate monitoring on all plans, so you get warned before certificate expiration causes downtime.
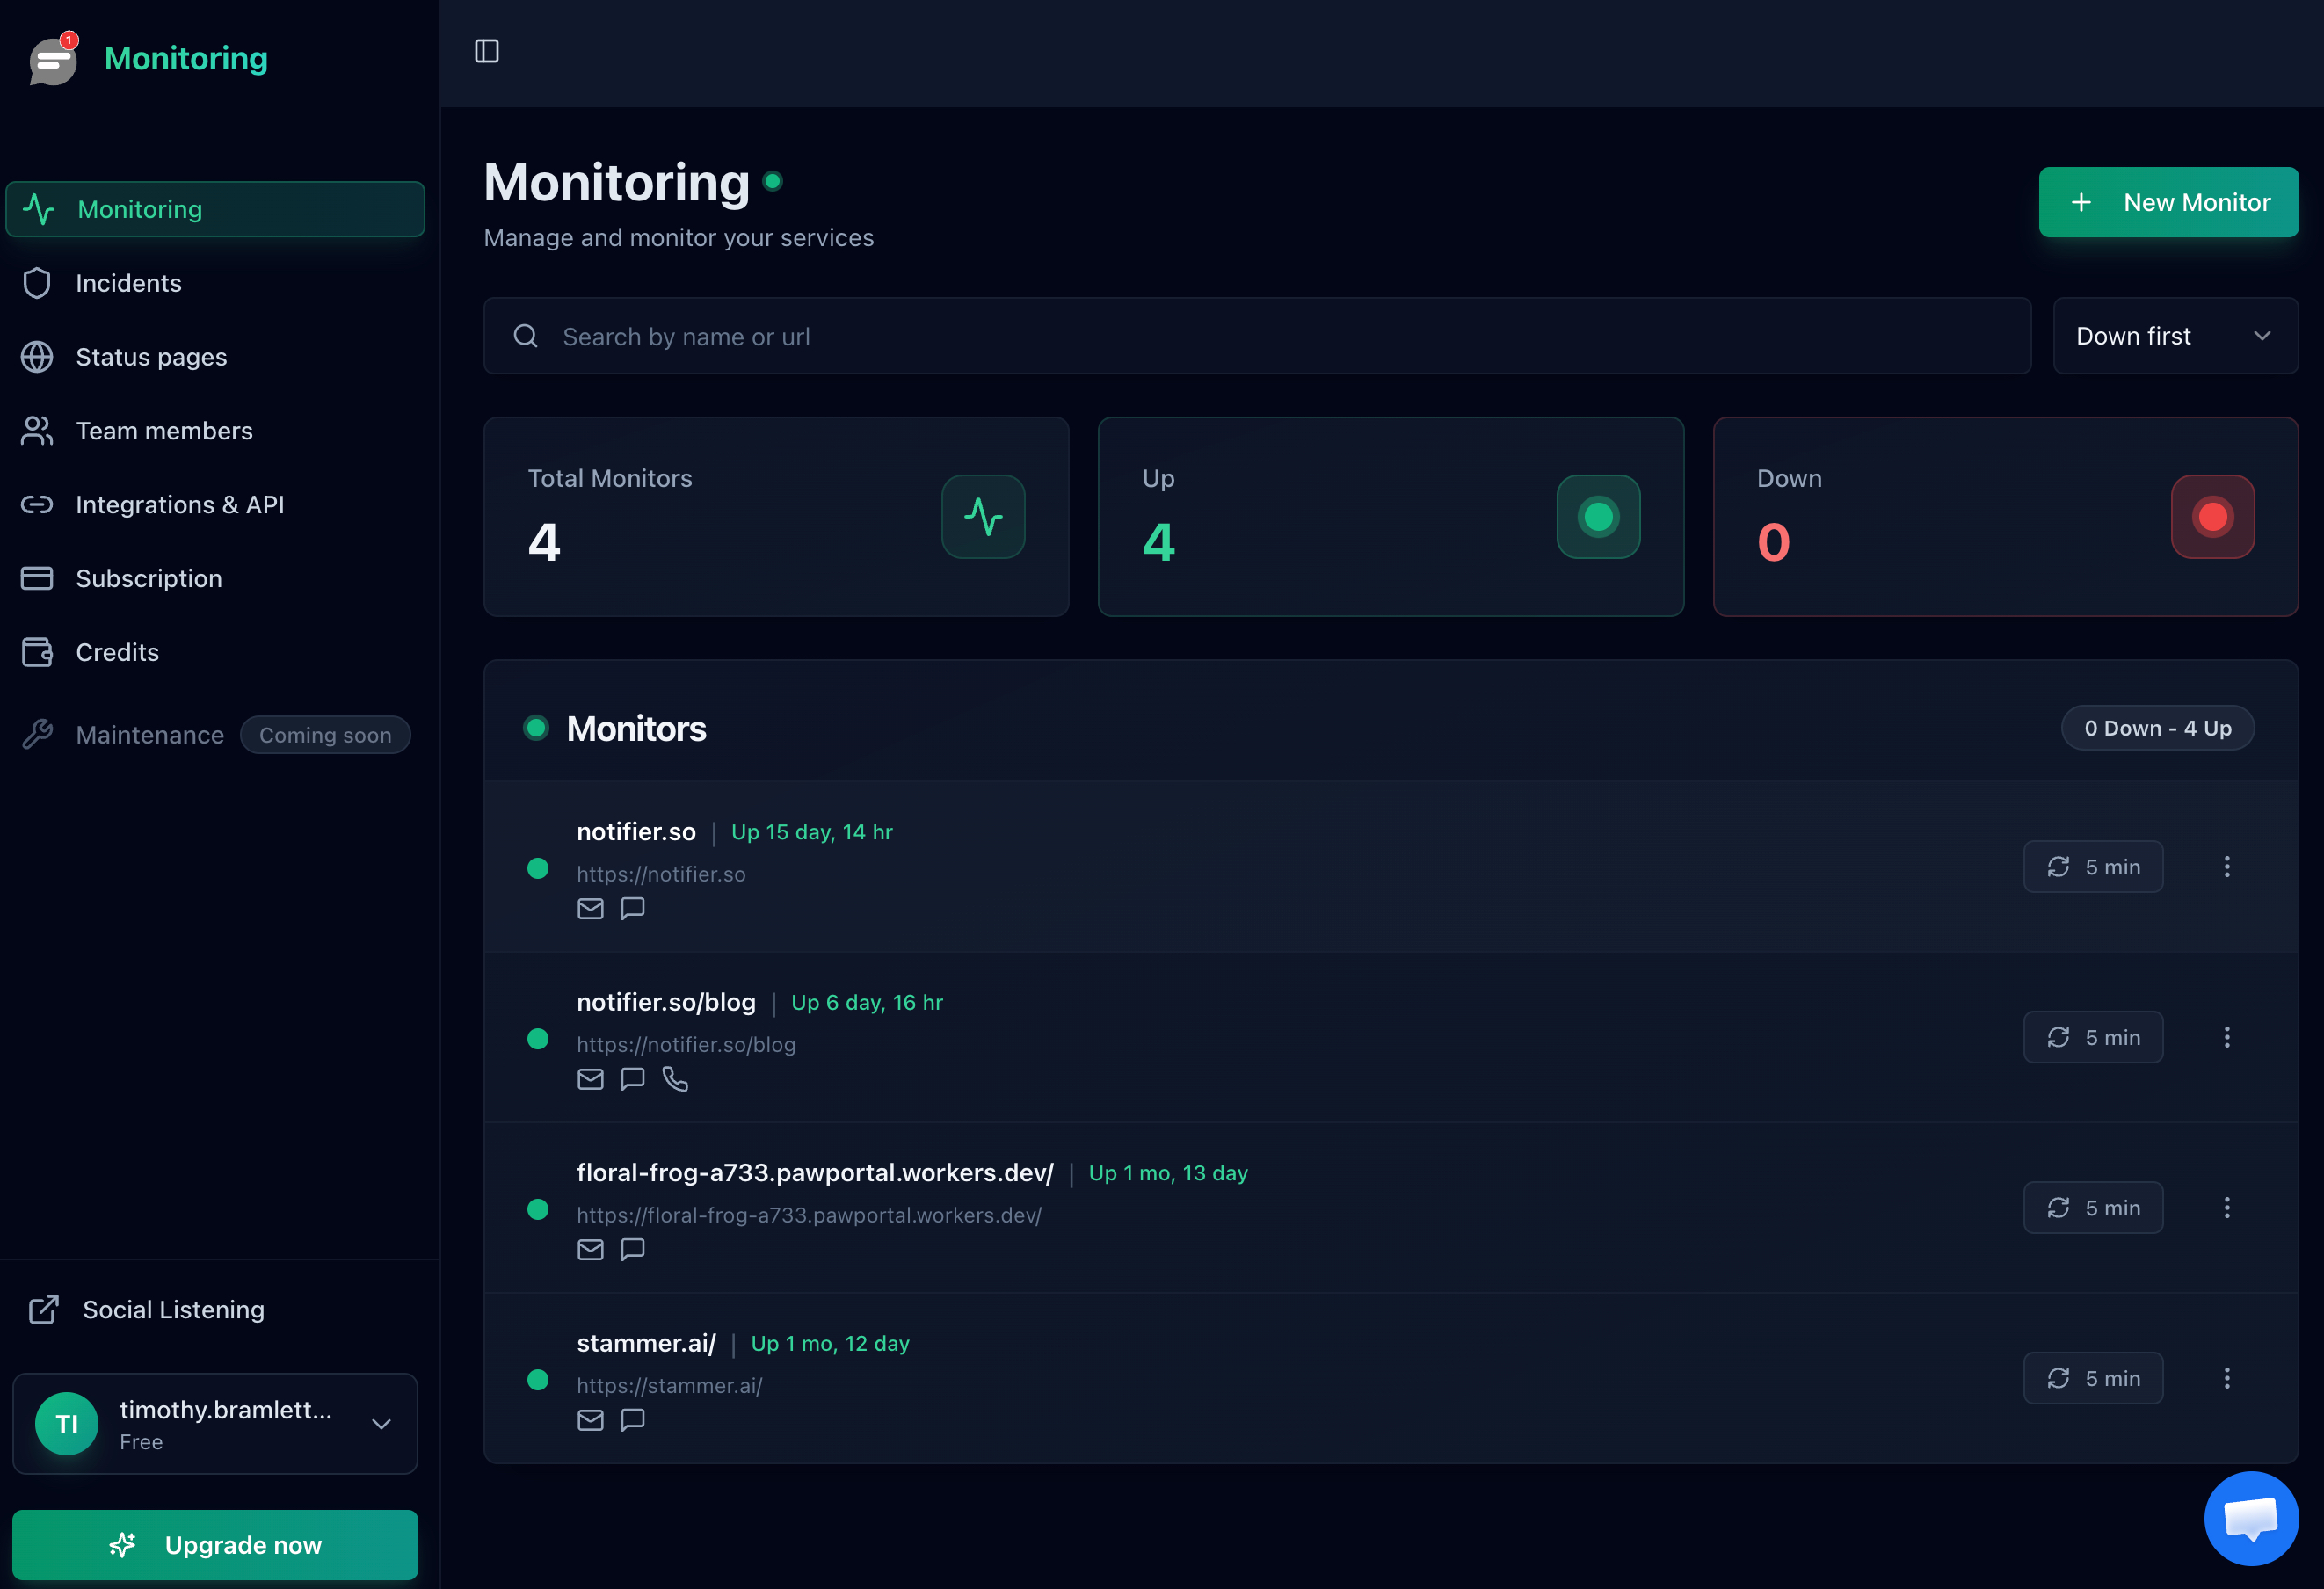
The Notifier dashboard showing all monitored servers at a glance.
2. Internal Heartbeats
With heartbeat monitoring, your server sends a signal ("I'm alive") to an external service at regular intervals. If the heartbeat stops, the monitoring service knows something is wrong.
This approach is useful for background jobs, cron tasks, or internal services that don't have a public URL to monitor. For example, if you have a job that runs every hour to process payments, you can have it send a heartbeat when it completes. If the heartbeat doesn't arrive on schedule, you know the job failed. For more on this approach, see our guide on cron job monitoring.
The downside: if your network is up but your server is overloaded or partially broken, it might still send heartbeats while failing to serve actual requests.
3. Log Analysis and Network Downtime Analysis
Your server logs contain valuable information about errors and failures. By monitoring logs for specific patterns (like 500 errors, connection timeouts, or crash traces), you can detect problems before they become complete outages. This kind of network downtime analysis helps you understand not just that something failed, but why.
You can do basic log analysis from the command line. Here are some useful commands for checking your server logs:
# Watch for 500 errors in real time (nginx)
tail -f /var/log/nginx/error.log | grep "500"

# Count 500 errors in the last hour (apache)
grep "$(date +'%d/%b/%Y:%H')" /var/log/apache2/access.log | grep " 500 " | wc -l

# Find the most common errors in your log
cat /var/log/nginx/error.log | cut -d' ' -f9- | sort | uniq -c | sort -rn | head -20

# Monitor application crashes (systemd services)
journalctl -u your-service-name -f --since "1 hour ago"
For automated alerting, tools like Datadog, Logtail, and Papertrail can watch your logs continuously and notify you when error rates spike. This is more of an early warning system than downtime detection since it catches problems while your server is still partially working.
For most small to medium teams, log analysis is a nice addition to external monitoring, not a replacement for it.
4. Synthetic Monitoring
Synthetic monitoring goes beyond simple uptime checks. Instead of just checking if your server responds, it simulates real user actions: logging in, adding items to a cart, submitting forms.
This catches issues that basic monitoring misses. Your homepage might load fine, but the checkout flow could be broken. Synthetic monitoring would catch that.
The trade-off is complexity and cost. Synthetic monitoring requires writing and maintaining test scripts, and most services charge more for it. For critical user flows, it's worth it. For basic server downtime detection, external HTTP checks are usually enough.
Alert Channels: How to Get Notified
Detecting downtime is only half the problem. You also need to be notified quickly enough to respond. Different channels work for different situations.
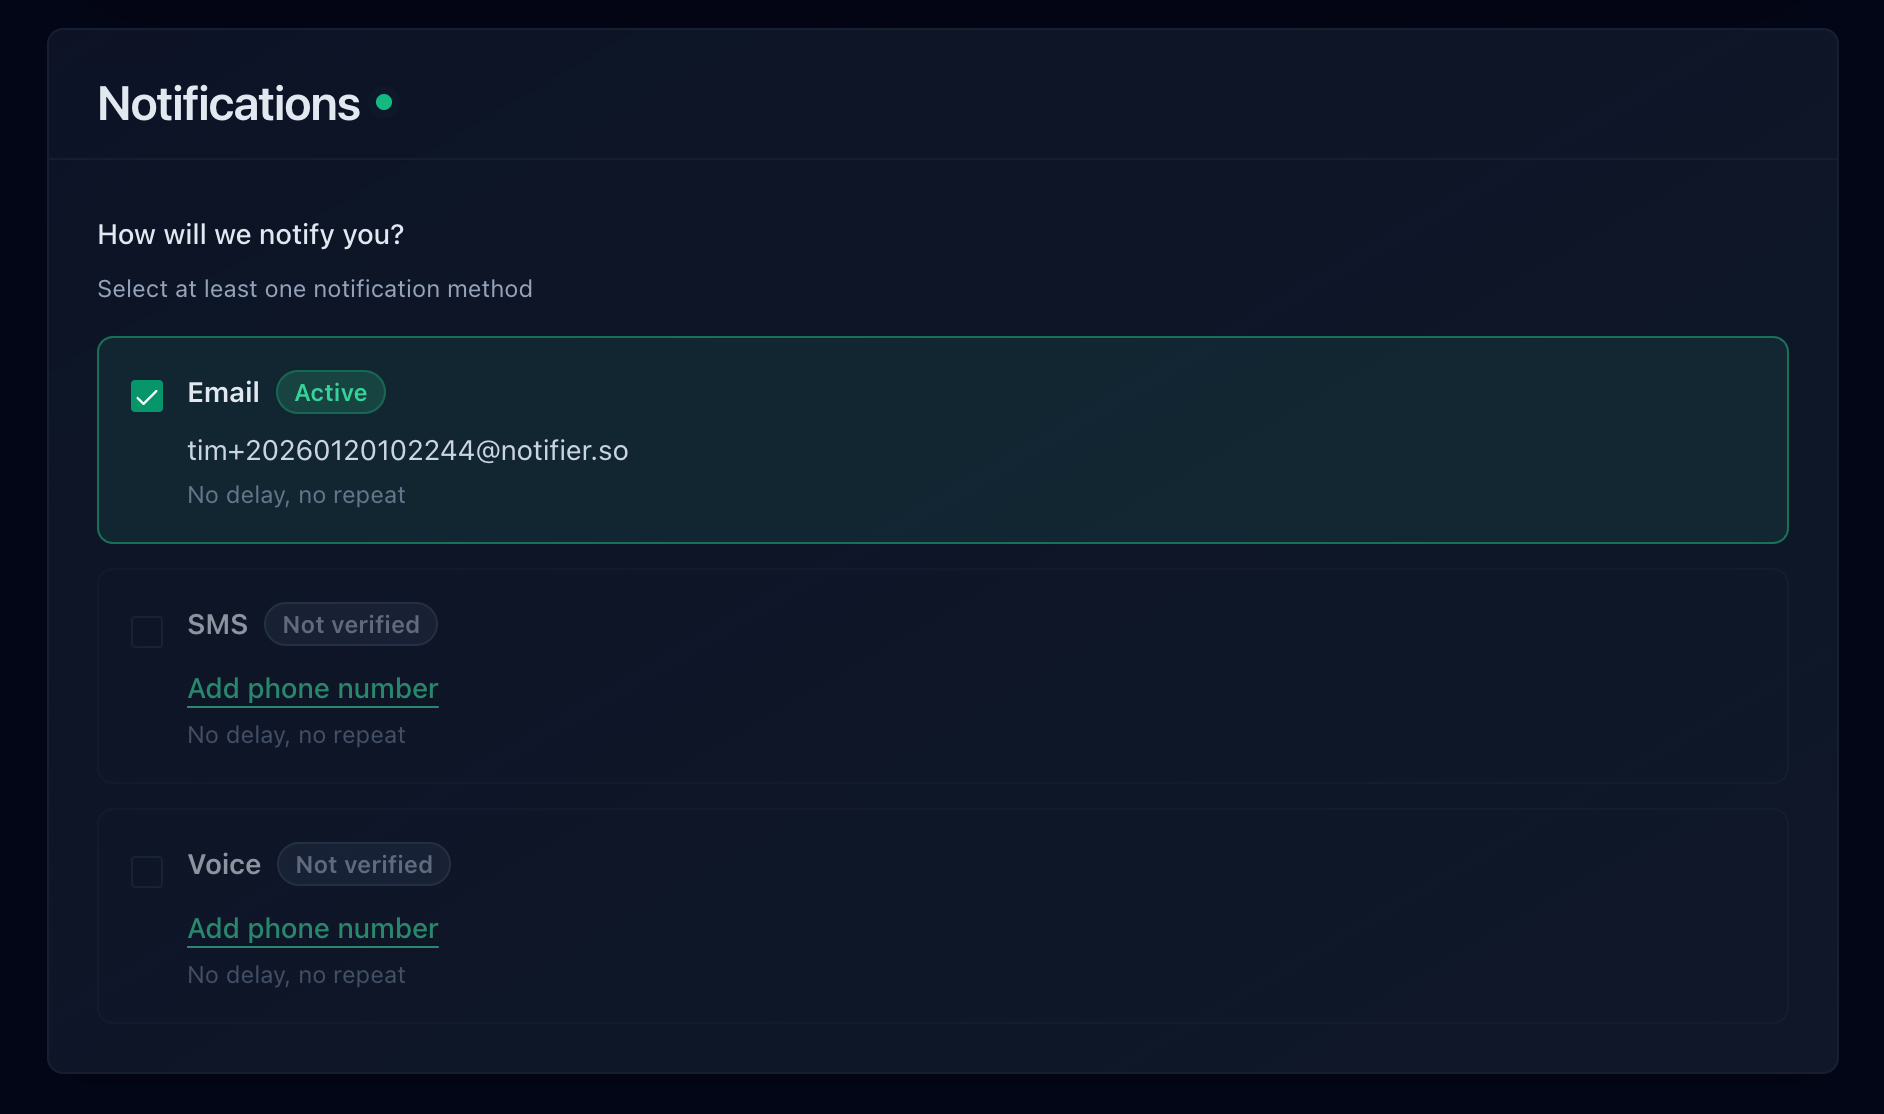
Notifier supports email, SMS, phone call, and Slack alerts.
Email is reliable and universal. Everyone has email, and it works even when you're not actively watching your phone. The downside: it's not instant, and important alerts can get buried in a busy inbox.
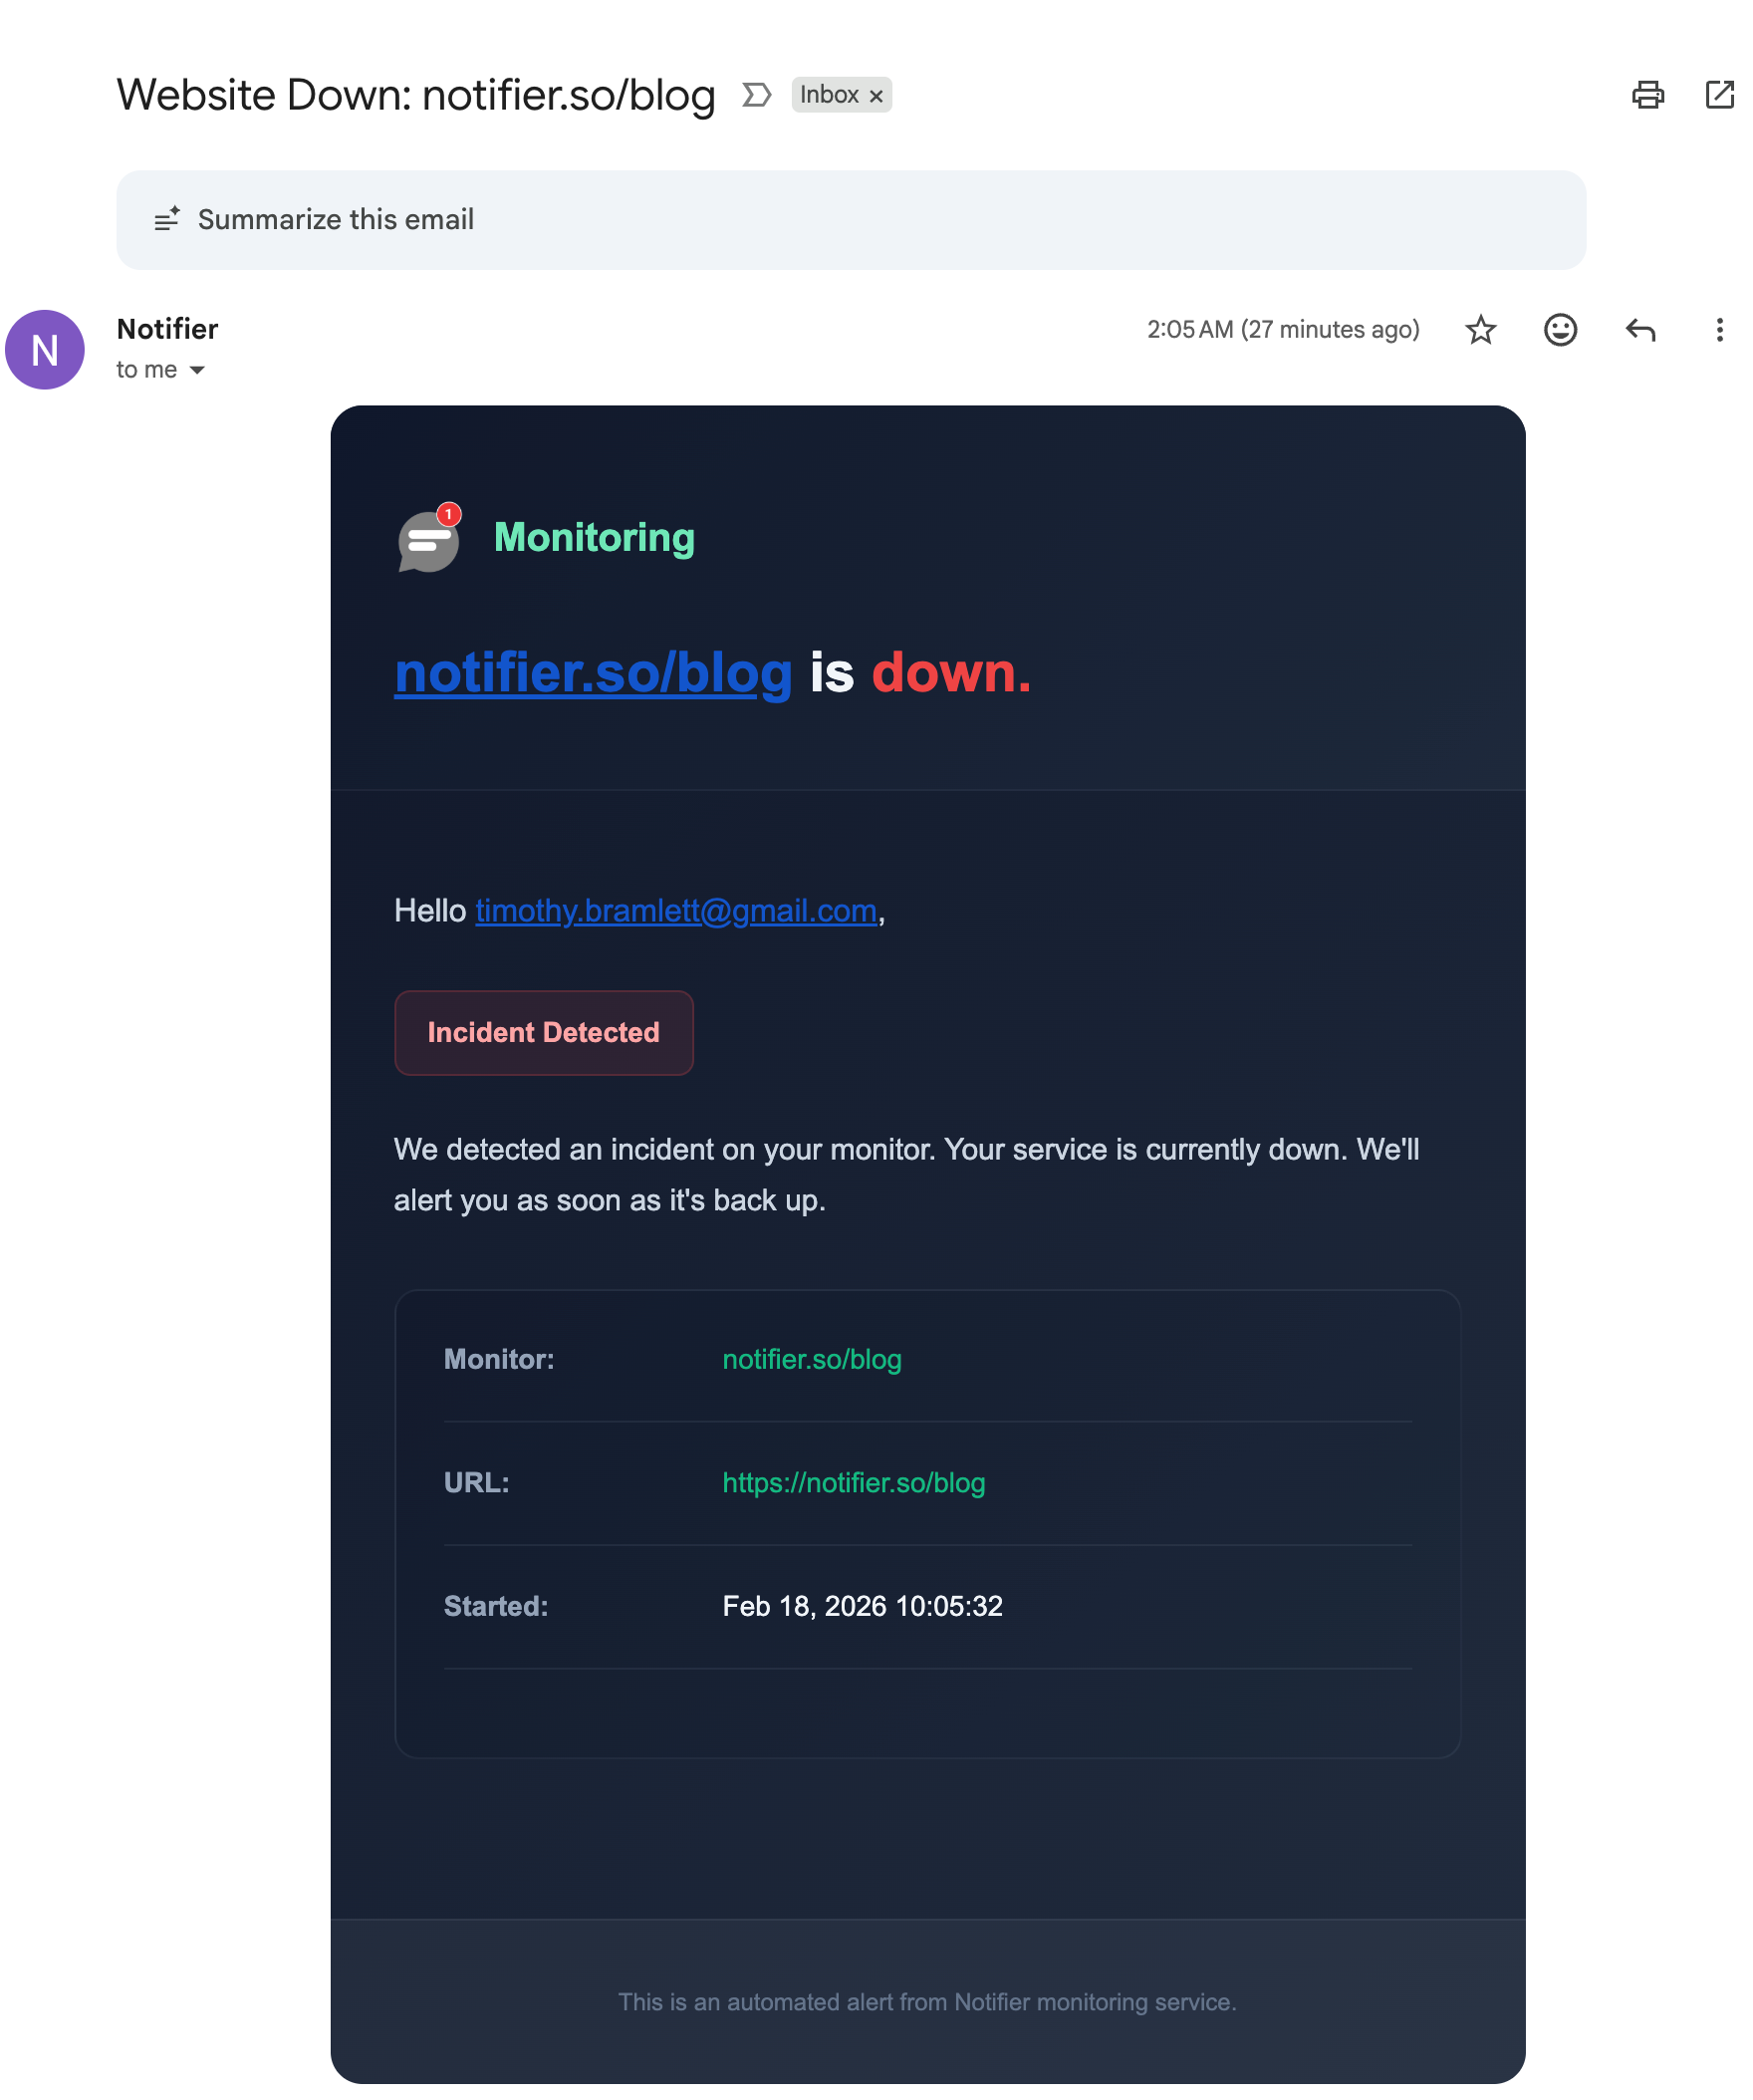
A downtime alert email from Notifier with incident details.
Best for: Non-urgent notifications, detailed incident reports, and backup alerts when other channels fail.
SMS
SMS alerts hit your phone directly. You don't need internet access, and the notification cuts through other distractions. This makes SMS ideal for critical alerts that need immediate attention.
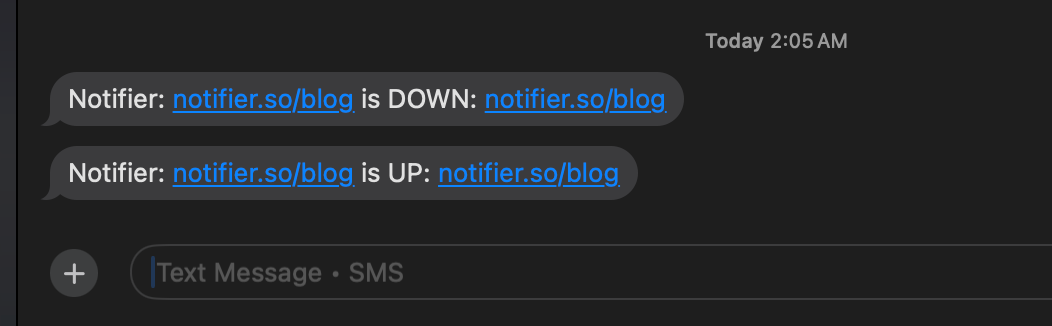
SMS alerts showing both downtime and recovery notifications.
Best for: Critical alerts, after-hours notifications, and situations where you need to wake up and respond.
Phone Calls
For truly critical situations, phone calls ensure you don't miss an alert. Your phone will ring until you answer or acknowledge the problem. Some services even support escalation: if you don't answer, call the next person on the list.
Listen to an example Notifier phone call alert:
Best for: Production outages that affect revenue, situations where you're on call, or when SMS might be missed.
Slack and Team Chat
Integrating alerts with Slack or Microsoft Teams keeps your whole team informed. When the server goes down, everyone in the channel sees it. This is useful for team coordination during incidents.
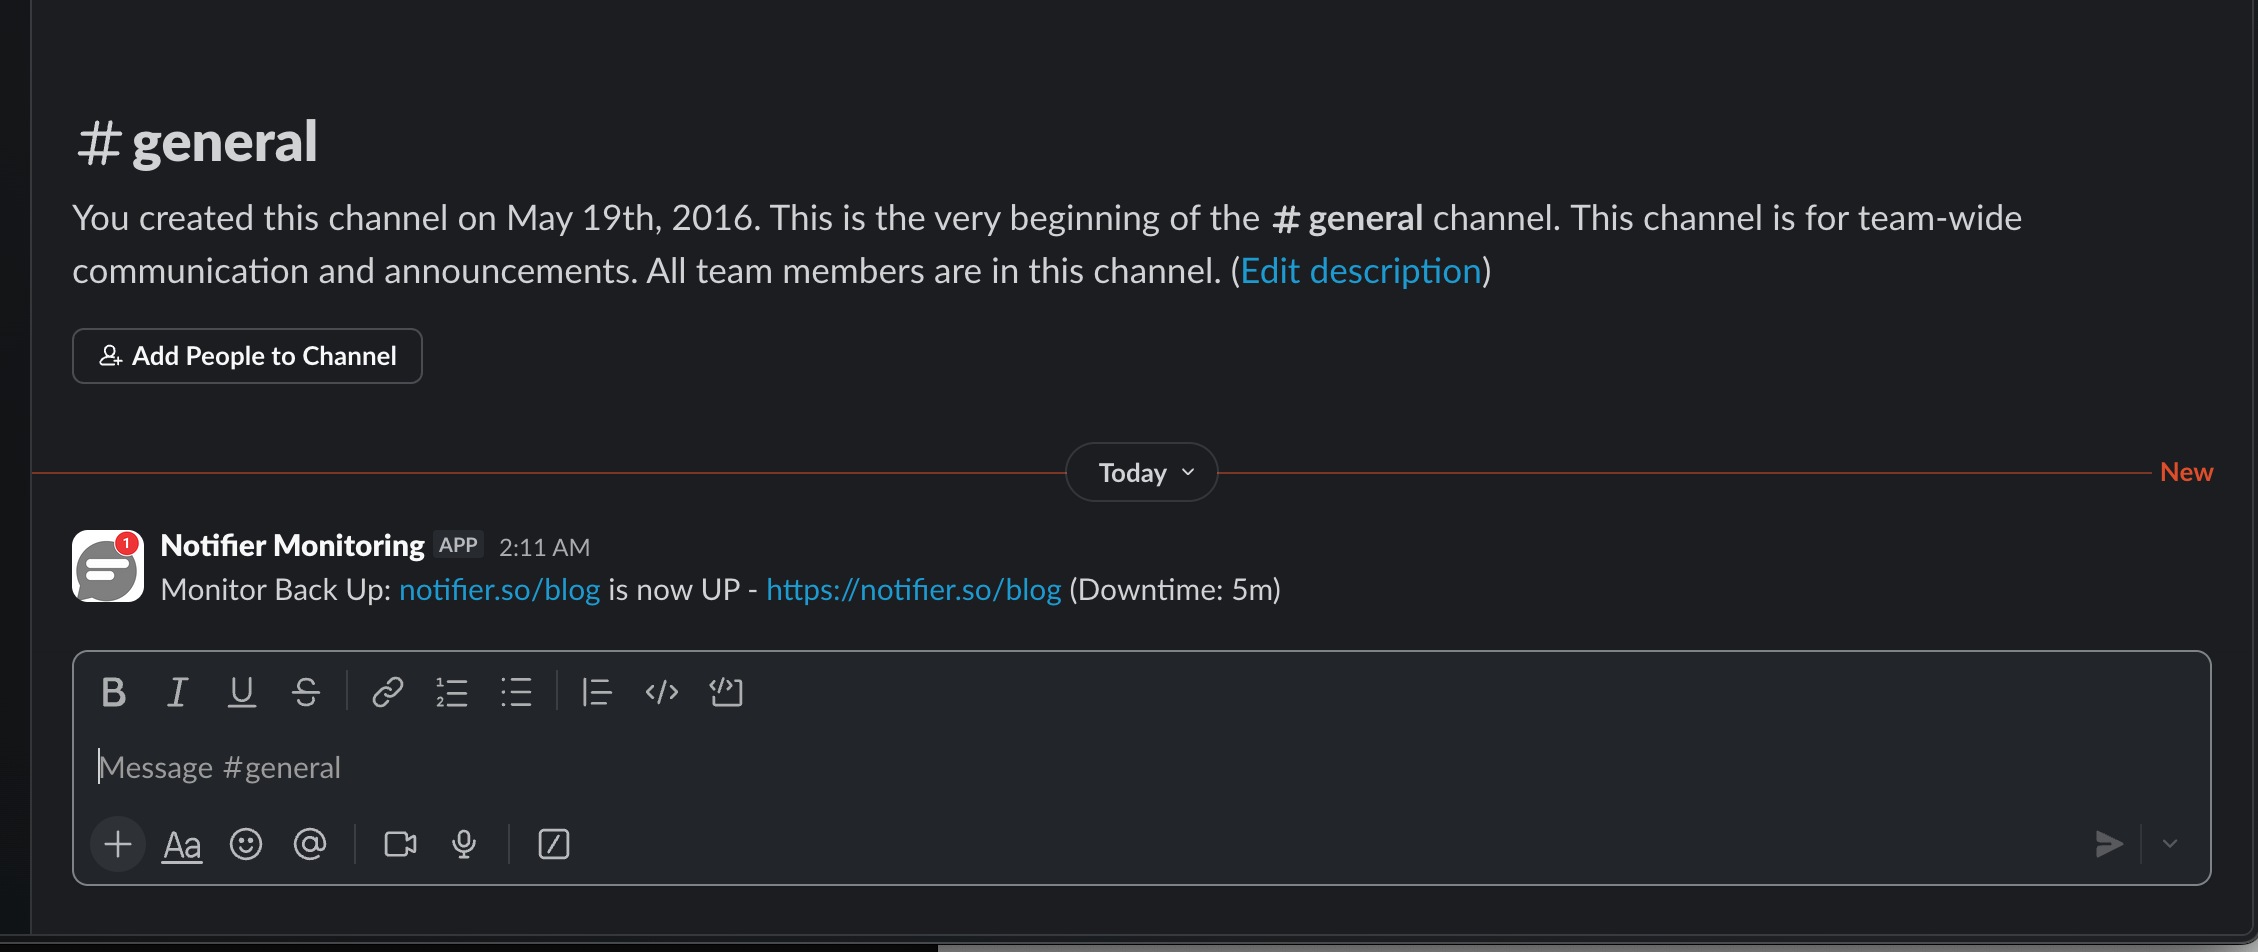
A recovery alert in Slack from Notifier.
Best for: Team awareness, incident coordination, and keeping a record of alerts in context. For a full setup walkthrough, see our guide on uptime monitoring with Slack alerts.
Webhooks
Webhooks let you build custom integrations. When downtime is detected, the monitoring service sends a POST request to your URL with details about the incident. You can use this to trigger automated responses: restart a service, spin up a backup server, or update an internal dashboard.
Best for: Custom automation, integrating with incident management tools, and triggering automatic remediation.
Check Intervals: Speed vs. Cost
How often should your monitoring service check your server? The answer depends on how quickly you need to know about problems.
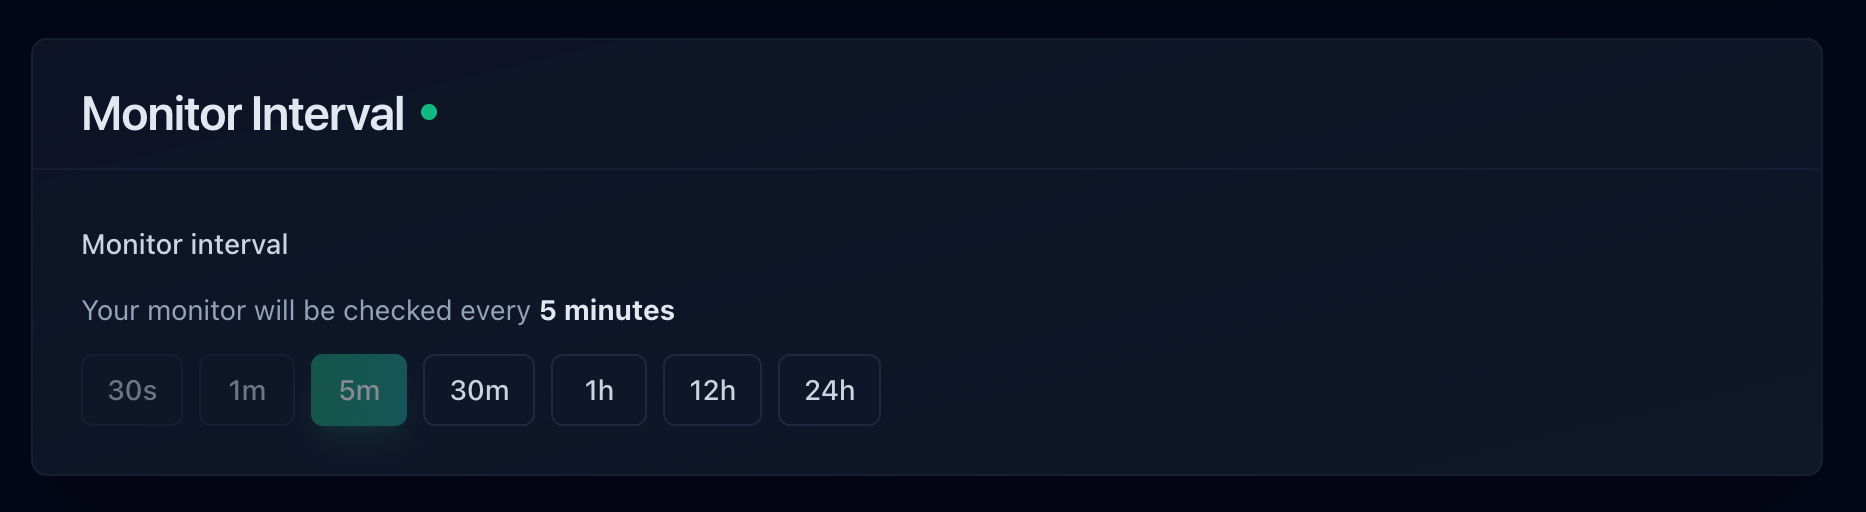
Choosing a check interval when setting up a monitor.
- 5 minute checks: Good for most websites and applications. If your server goes down, you'll know within 5 minutes. This is what most free plans offer, including Notifier's free tier.
- 1 minute checks: Faster detection without being excessive. If uptime matters to your business, 1 minute checks are a reasonable investment. Available on Notifier's Solo plan ($4/mo).
- 30 second checks: For services where every minute of downtime has significant impact. E-commerce sites, financial services, and high-traffic applications often use 30 second or faster checks. Available on Notifier's Team plan ($19/mo).
Keep in mind that faster checks usually mean higher costs. Most monitoring services charge more for shorter intervals. Find the balance that makes sense for your situation.
Setting Up Server Downtime Detection
The fastest way to set up server downtime detection is with an external monitoring service. Here's what it looks like with Notifier:
- 1. Create an account: Sign up at notifier.so/register. The free plan includes 10 monitors with SSL monitoring.
- 2. Add your server URL: Enter the URL you want to monitor. This can be your homepage, an API endpoint, or a health check URL.
- 3. Choose your check interval: Start with 5 minutes on the free plan, or upgrade for faster checks.
- 4. Configure alerts: Enable email, SMS, or phone call notifications. Add Slack if your team uses it.
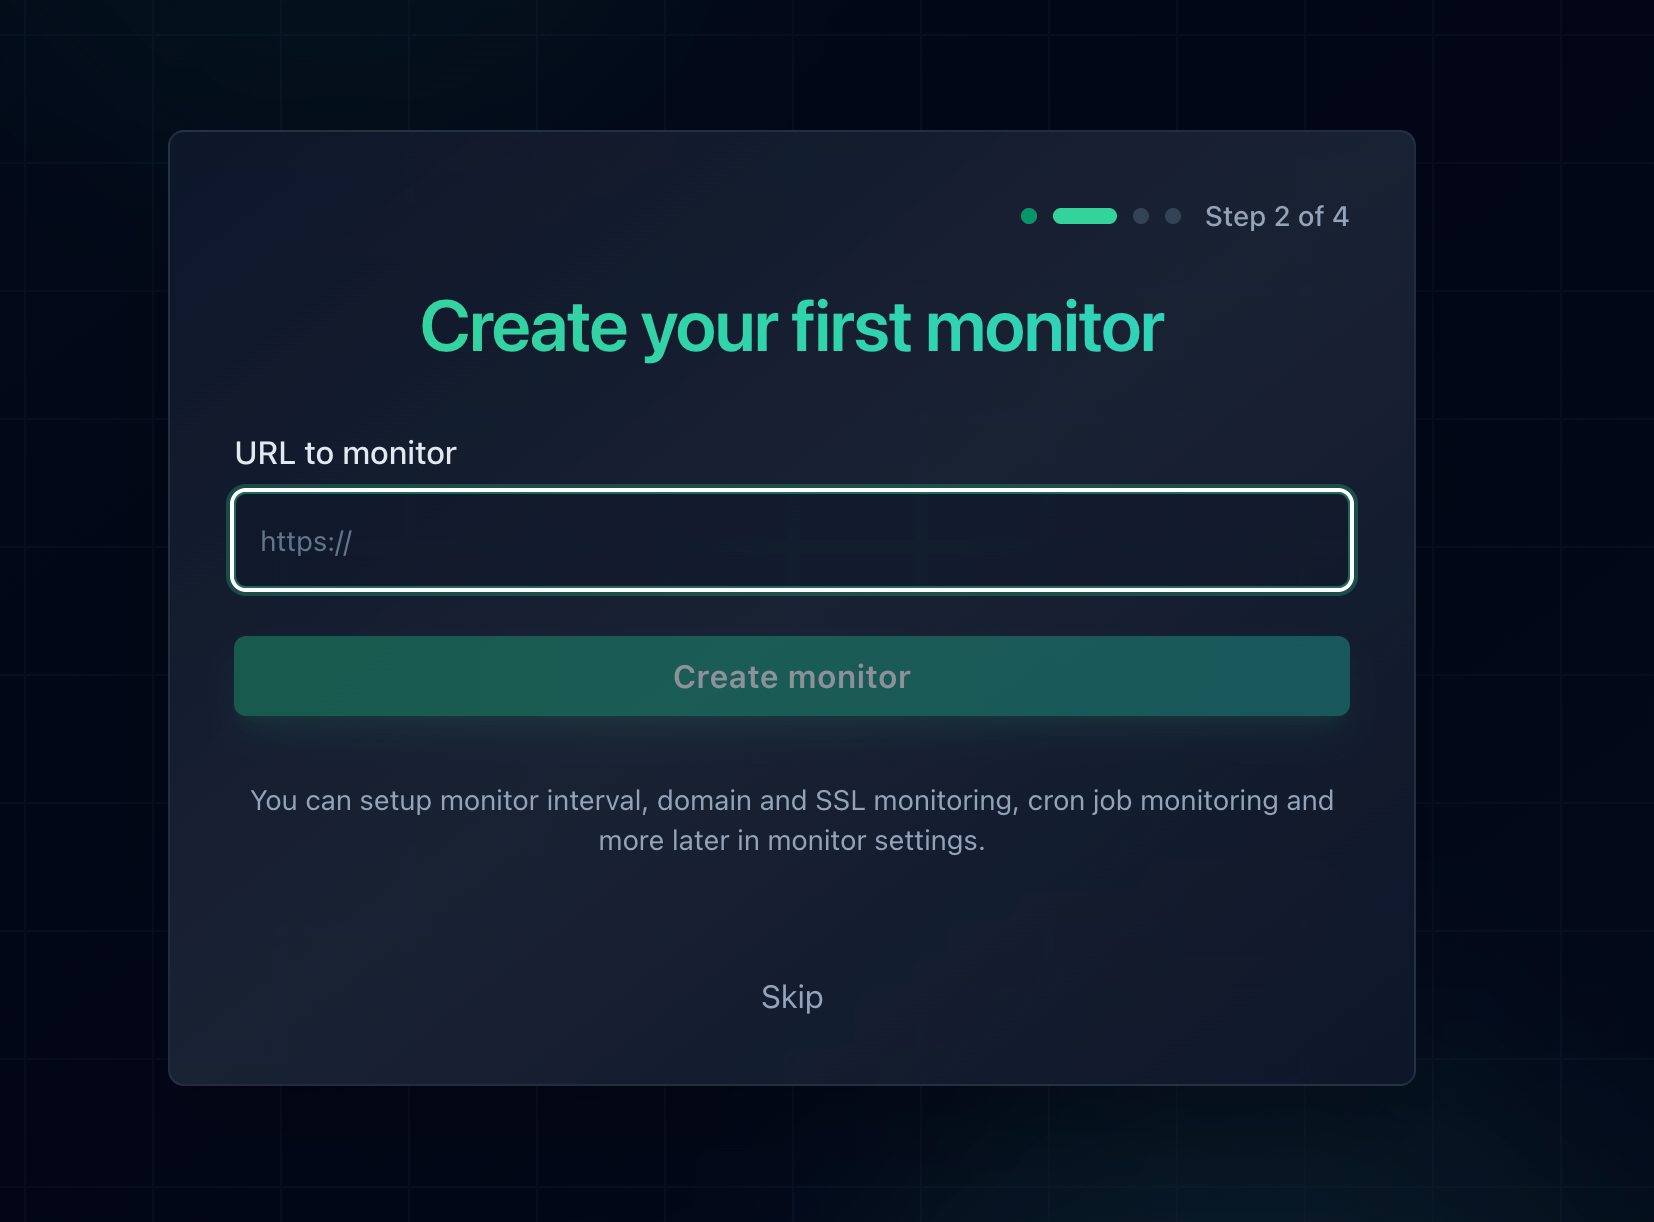
Adding a new monitor in Notifier takes about 30 seconds.
That's it. Your server is now being monitored. When it goes down, you'll be notified immediately. For a detailed walkthrough with screenshots, see our website monitoring setup guide.
Best Practices for Server Downtime Detection
- Monitor from multiple locations: A server might be reachable from one region but not another. Multi-location monitoring catches regional issues that single-location checks would miss.
- Set up redundant alert channels: Don't rely on just email. Add SMS or phone calls for critical services. If one channel fails, the others still work.
-
Create a health check endpoint: Instead of monitoring your homepage (which might be cached), create a dedicated
/healthendpoint that actually checks if your application is working. See our guide on monitoring API endpoints for examples. - Monitor SSL certificates too: An expired SSL certificate effectively takes your site offline for visitors. Use a service that includes SSL certificate monitoring so you get warned before expiration.
- Avoid alert fatigue: Too many false positives will train you to ignore alerts. Tune your monitoring to reduce noise: add confirmation checks, ignore brief blips, and set appropriate thresholds.
- Document your response process: When an alert fires, what do you do? Having a clear response playbook reduces response time during stressful situations.
- Set up a status page: Let your users know what's happening during incidents. A public status page reduces support tickets and builds trust.
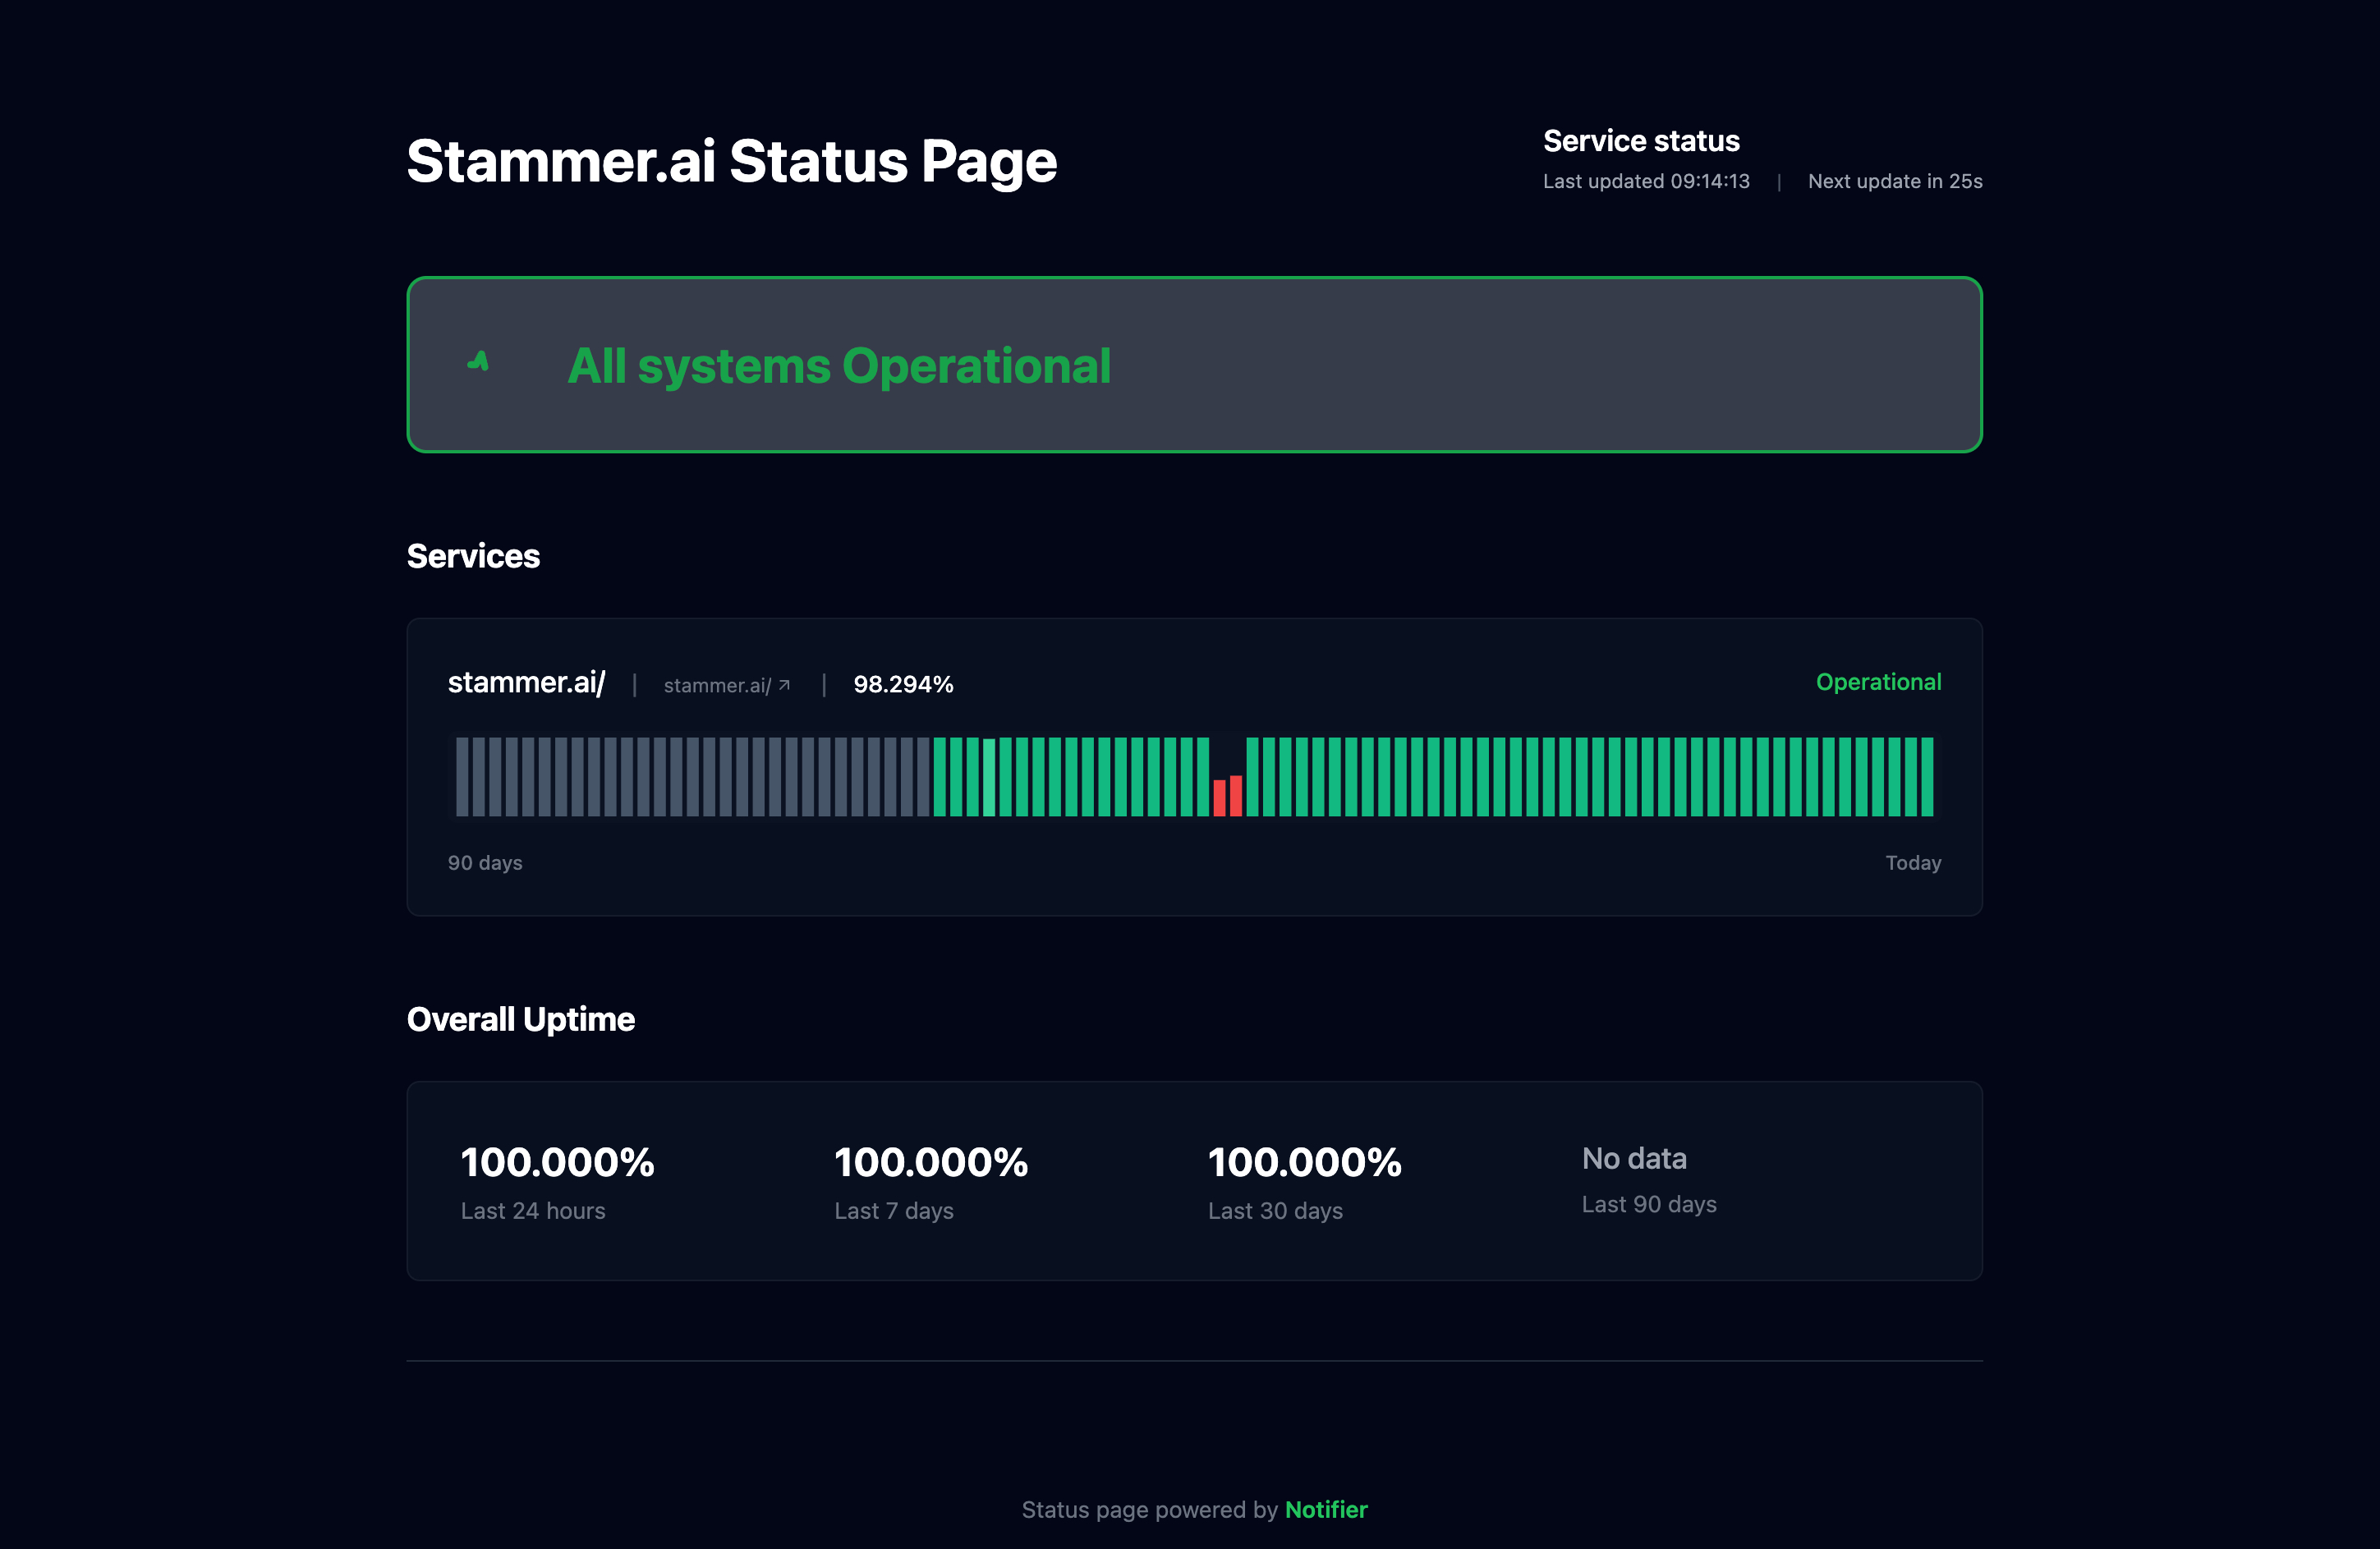
A public status page built with Notifier.
Don't Wait for Customers to Tell You
Server downtime will happen. Databases crash, hosting providers have issues, deployments go wrong. The question isn't whether you'll have downtime, but how quickly you'll know about it.
With proper server downtime detection in place, you can go from "customers are complaining" to "we fixed it before anyone noticed." That's the difference between a stressful incident and a non-event.
If you haven't set up monitoring yet, start with Notifier's free plan. You get 10 monitors, SSL certificate monitoring, 5 status pages, and alerts via email, SMS, and phone call. Setup takes about 30 seconds.
Frequently Asked Questions
What is server downtime detection?
Server downtime detection is the process of automatically identifying when a server becomes unavailable or unresponsive. It typically involves an external service that sends requests to your server at regular intervals and alerts you when it stops responding. This lets you fix problems before most users are affected.
What is network downtime analysis?
Network downtime analysis is the process of examining outage data to understand why services went offline, how long they were down, and what patterns exist. It involves reviewing uptime logs, response time trends, and incident history across multiple services to identify root causes and prevent future outages. Most monitoring tools provide this data through dashboards and uptime history reports.
How quickly can server downtime be detected?
Detection speed depends on your check interval. With 30-second checks, you can detect downtime in under a minute. With 5-minute checks (common on free plans), detection takes up to 5 minutes. Most monitoring services confirm downtime with a second check from a different location before alerting to avoid false positives, which adds a small delay.
What's the difference between external monitoring and internal monitoring?
External monitoring checks your server from outside your infrastructure, the same way your users access it. It catches network issues, DNS failures, and SSL problems that internal monitoring would miss. Internal monitoring (heartbeats, log analysis) runs on or near your server and provides deeper insight into why something is failing. The best approach is to use both: external monitoring for detection and internal monitoring for diagnosis.
Is there a free server downtime detection tool?
Notifier offers a free plan with 10 monitors, 5 status pages, SSL certificate monitoring, and alerts via email, SMS, and phone call. Check intervals are 5 minutes on the free plan. For a comparison of free options, see our guide on best free website monitoring tools.