At a Glance
- •Magento stores are especially prone to downtime due to heavy resource requirements, complex caching layers (Varnish, Redis), Elasticsearch/OpenSearch dependencies, and custom module conflicts.
- •Monitor at least five URLs: storefront homepage, checkout page, admin panel (/admin), a product or category page, and your search results page. Add API endpoints if you use headless or PWA.
- •Use Magento CLI commands (bin/magento indexer:status, cron:status, cache:status) for internal health checks alongside external uptime monitoring for full coverage.
- •SSL certificate monitoring is critical for Magento stores because expired certificates block checkout entirely and trigger browser security warnings that destroy buyer confidence.
- •Notifier monitors all of this (including SSL certificates) free for up to 10 URLs with email, SMS, and phone call alerts on every plan. Paid plans start at $4/month.
Magento (now Adobe Commerce) powers some of the largest online stores in the world. It's also one of the most resource-intensive e-commerce platforms to run. Between Varnish caching, Redis sessions, Elasticsearch indexing, and dozens of custom modules, there are more failure points than on any other mainstream e-commerce platform. When something breaks, you lose sales immediately.
This guide covers the specific reasons Magento stores go down, exactly what URLs and services to monitor, the Magento CLI commands that reveal hidden problems, and how to set up external monitoring so you know about outages before your customers do. If you run a Magento or Adobe Commerce store, this is your complete monitoring playbook.
Why Magento Stores Are Especially Prone to Downtime
Magento is powerful, but that power comes with complexity. Unlike hosted platforms like Shopify, you're responsible for every layer of the stack. Here are the most common reasons Magento stores experience downtime.
Heavy Server Resource Requirements
Magento 2 requires significantly more server resources than most e-commerce platforms. A production store typically needs at least 4 GB of RAM for PHP alone, plus additional memory for MySQL, Redis, and Elasticsearch. Stores with large catalogs (10,000+ SKUs) or high traffic can easily overwhelm servers that would comfortably handle a WooCommerce or Shopify store. When memory runs low, PHP processes start failing, and customers see 500 errors or blank pages.
Varnish and Redis Caching Failures
Magento relies heavily on Varnish (for full-page caching) and Redis (for session storage and backend cache). When these caching layers work, Magento is fast. When they fail, everything falls apart. A Varnish crash means every request hits PHP directly, which can overload your server in seconds. A Redis failure means sessions are lost (customers get logged out mid-checkout) and backend cache misses cause extreme slowness. These caching failures are among the most common causes of Magento downtime.
Elasticsearch and OpenSearch Dependencies
Starting with Magento 2.4, Elasticsearch (or OpenSearch) is required for catalog search. If your Elasticsearch instance goes down or runs out of memory, search stops working entirely. On many Magento stores, this also breaks category pages that rely on Elasticsearch for product filtering and sorting. The result: customers can browse your homepage but can't find or filter products.
Custom Module Conflicts
Most production Magento stores run 20 to 50 third-party modules (extensions). After a Magento core update or a module update, conflicts between modules can cause fatal errors, white screens, or broken checkout flows. A single poorly written module can introduce memory leaks that crash PHP over time. This is one of the biggest differences between Magento and hosted platforms: every extension you install is another potential failure point.
Indexer Failures
Magento uses indexers to keep product data, prices, categories, and search results up to date. When an indexer gets stuck or fails (often due to database locks or memory limits), your store can display stale prices, missing products, or broken category listings. Indexer problems are especially insidious because the storefront appears to work, but the data is wrong. Customers see the wrong price, add a product to cart, and then the order fails at checkout.
Cron Job Failures
Magento depends on cron jobs for dozens of background tasks: sending emails, processing scheduled catalog price rules, cleaning up expired sessions, generating sitemaps, and running indexers. If the Magento cron stops running (which happens more often than you'd expect), these tasks silently pile up. Eventually, the cron backlog causes database table bloat, which slows down the entire store. For more on this topic, see our guide on cron job monitoring.
What to Monitor on a Magento Store
Monitoring just your homepage catches a fraction of real Magento failures. Your checkout can be down while the homepage serves perfectly from Varnish cache. Here's the complete list of what to track.
| What to Monitor | URL Example | Why It Matters | Interval |
|---|---|---|---|
| Storefront homepage | https://yourstore.com/ |
First page most customers land on | 1 min |
| Checkout page | https://yourstore.com/checkout/ |
Directly tied to revenue; often first to break | 30 sec |
| Category page | https://yourstore.com/women.html |
Relies on Elasticsearch; breaks when search is down | 1 min |
| Product page | https://yourstore.com/product-name.html |
Tests database and media delivery | 5 min |
| Admin panel | https://yourstore.com/admin/ |
If admin is down, you can't manage orders | 5 min |
| Search results | https://yourstore.com/catalogsearch/result/?q=test |
Directly tests Elasticsearch health | 5 min |
| REST API (if used) | https://yourstore.com/rest/V1/store/storeConfigs |
Tests API layer for headless/PWA setups | 1 min |
| SSL certificate | https://yourstore.com/ |
Expired SSL blocks all secure connections | Daily |
The key insight is that different parts of Magento depend on different backend services. Your homepage might be served entirely from Varnish cache, while category pages need Elasticsearch and checkout needs a working database and payment gateway. A single monitor on the homepage would miss failures in any of those backend services.
For a broader overview of e-commerce monitoring strategies, see our guide on website monitoring for e-commerce.
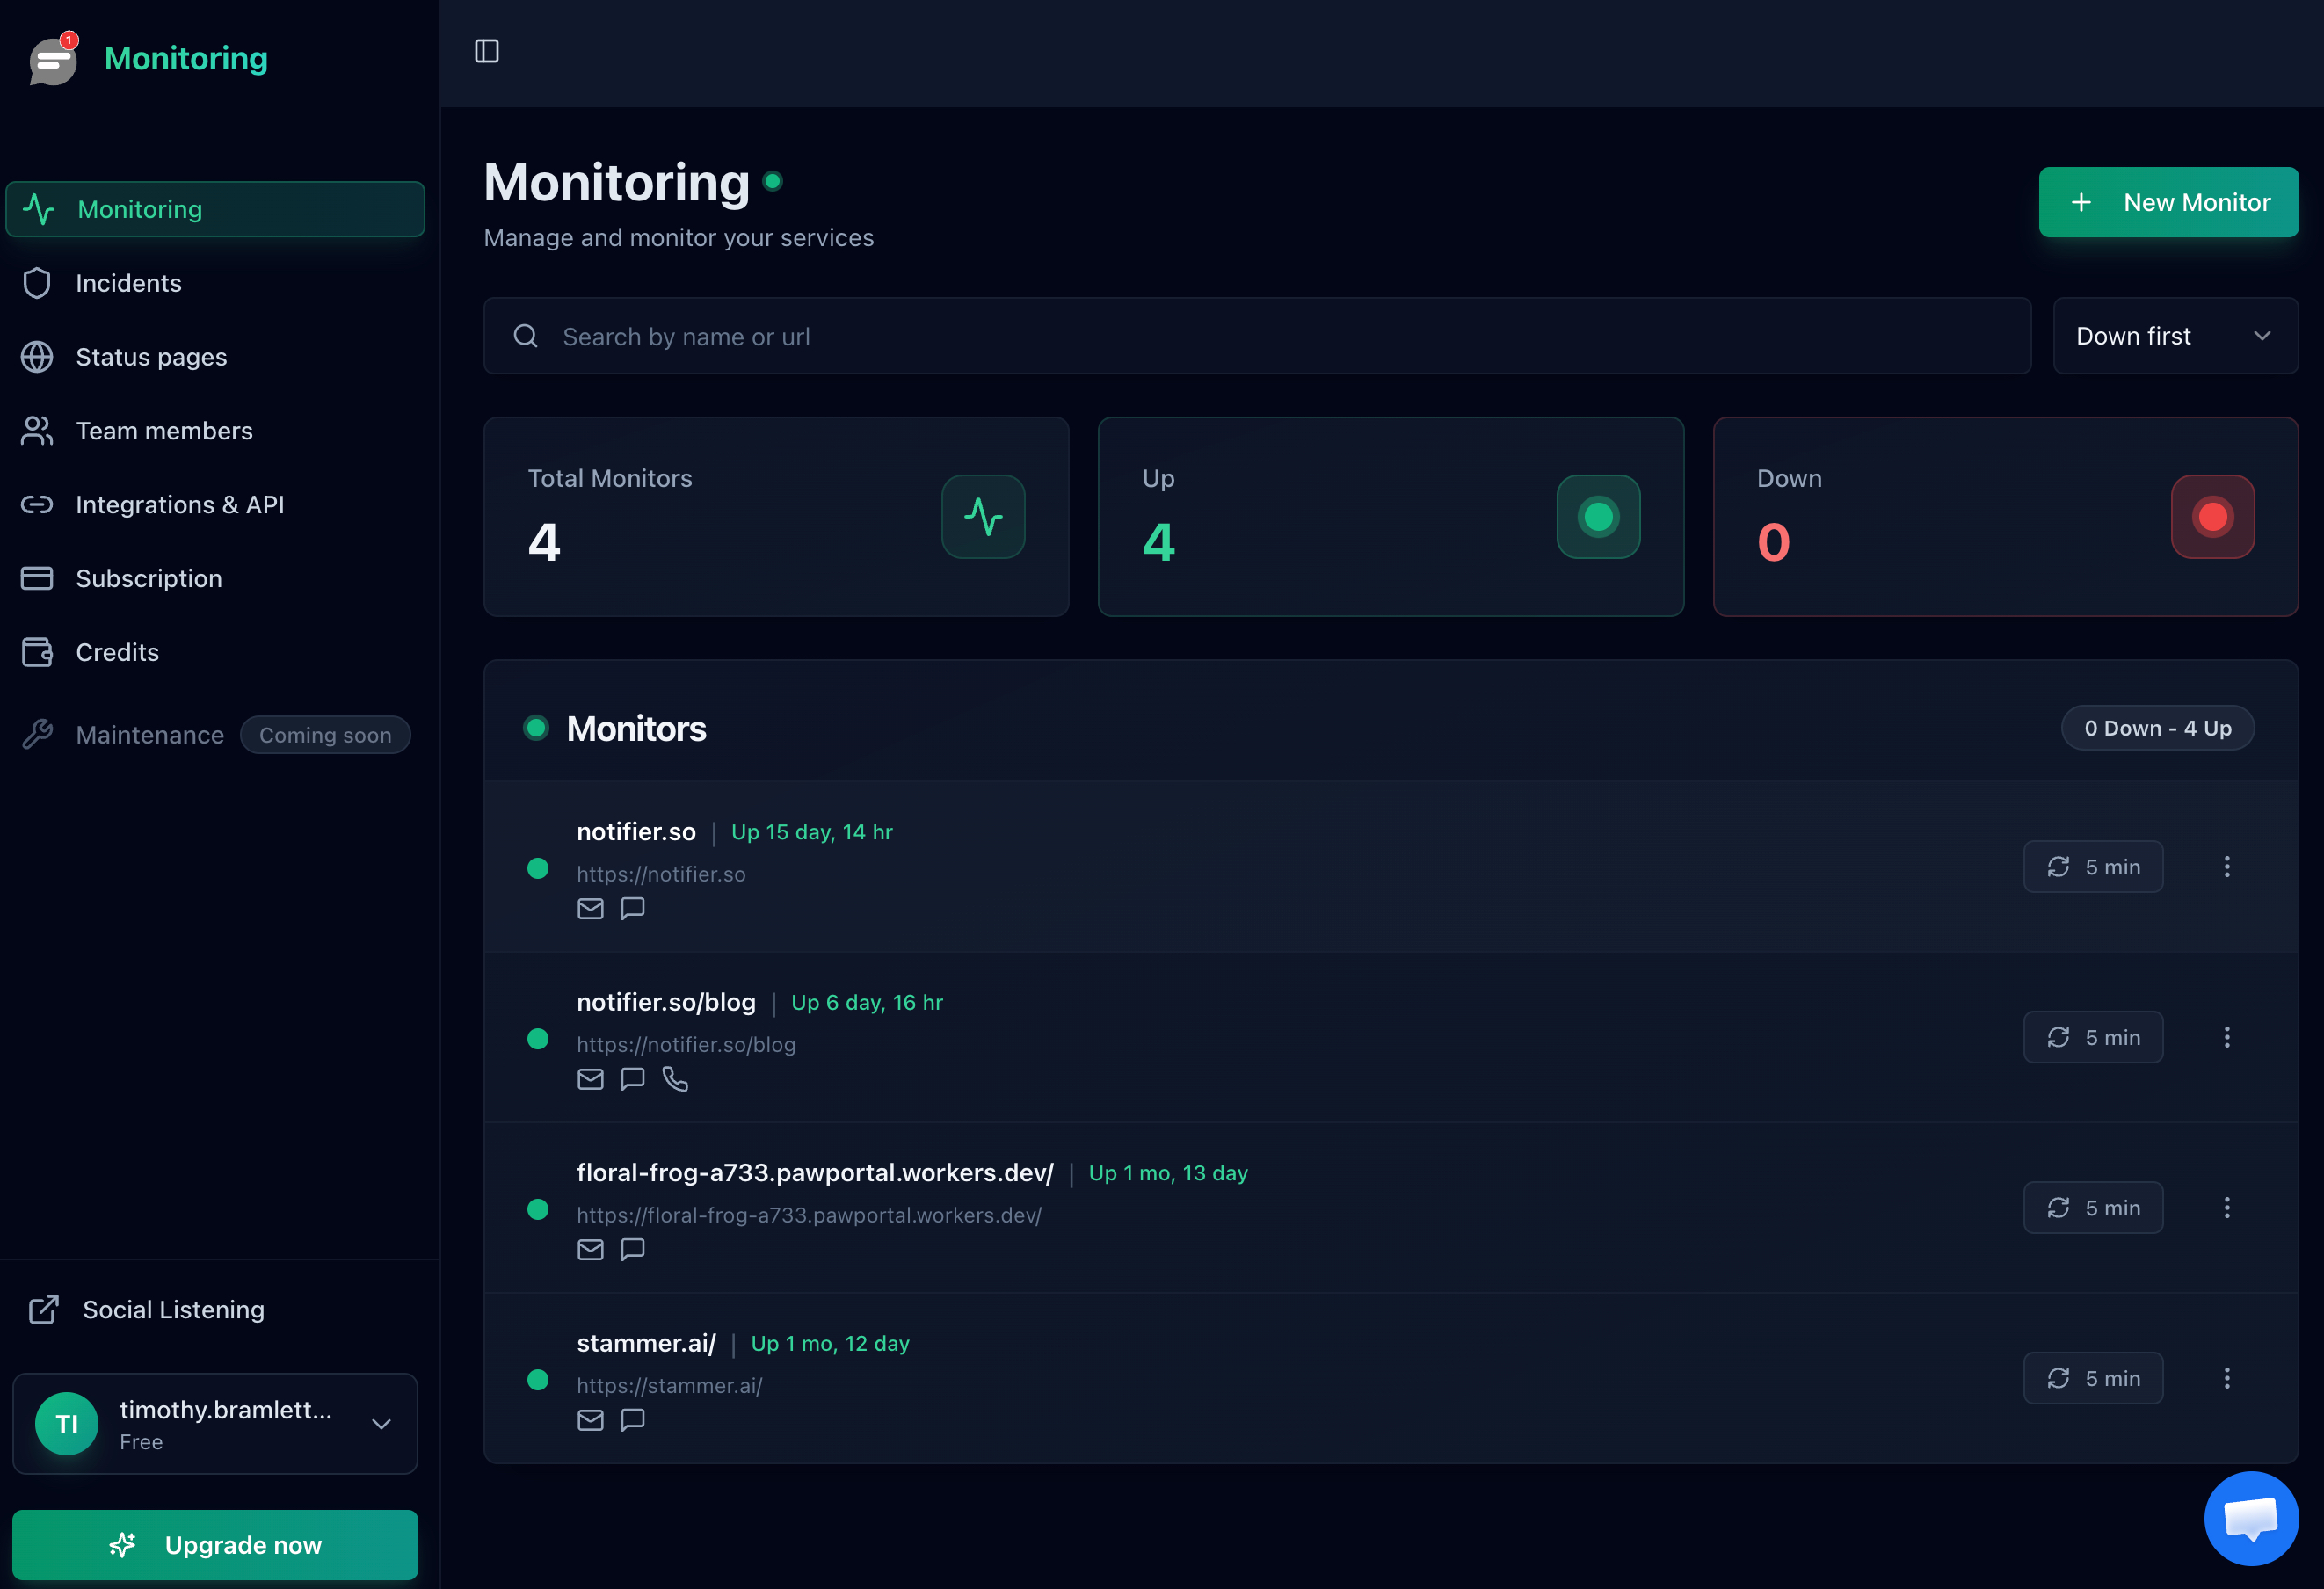
A monitoring dashboard tracking multiple Magento store endpoints.
Magento CLI Health Checks for Internal Monitoring
External monitoring tells you when your storefront is down. Internal health checks tell you why (and often catch problems before they become visible to customers). Magento includes several CLI commands that reveal the health of your store's internals.
Check Module and Database Status
This command verifies that your database schema matches your installed modules:
bin/magento setup:statusIf the output says "All modules are up to date," your database and code are in sync. If it says schema or data upgrades are needed, you have a deployment issue that could cause unexpected behavior.
Check Indexer Status
Indexers keep your catalog, prices, and search data up to date. Check their status with:
bin/magento indexer:statusHealthy output looks like this:
+---------------------------+---------------------+-------------------+-----+-----------+
| Title                     | Status              | Update On         | Sch | Sch Status|
+---------------------------+---------------------+-------------------+-----+-----------+
| Design Config Grid        | Ready               | Schedule          | Upd | idle      |
| Customer Grid             | Ready               | Schedule          | Upd | idle      |
| Category Products         | Ready               | Schedule          | Upd | idle      |
| Product Categories        | Ready               | Schedule          | Upd | idle      |
| Catalog Rule Product      | Ready               | Schedule          | Upd | idle      |
| Product Price             | Ready               | Schedule          | Upd | idle      |
| Product EAV               | Ready               | Schedule          | Upd | idle      |
| Inventory                 | Ready               | Schedule          | Upd | idle      |
| Catalog Search            | Ready               | Schedule          | Upd | idle      |
| Stock                     | Ready               | Schedule          | Upd | idle      |
+---------------------------+---------------------+-------------------+-----+-----------+
Watch for indexers with a status of "Reindex Required" or "Processing" that have been stuck for more than a few minutes. A stuck "Catalog Search" indexer means Elasticsearch is likely having problems. A stuck "Product Price" indexer means customers might see wrong prices.
Check Cron Status
Magento's cron handles dozens of background tasks. Check if it's running:
bin/magento cron:statusYou can also query the database directly to see recent cron activity:
# Check when cron last ran (via MySQL)
SELECT job_code, status, executed_at
FROM cron_schedule
WHERE status = 'success'
ORDER BY executed_at DESC
LIMIT 10;
If no cron jobs have completed in the last 15 minutes, your cron is likely stopped. This means emails aren't sending, indexers aren't updating, and the cron_schedule table is growing, which will eventually slow down your database.
Check Cache Status
bin/magento cache:statusThis shows which cache types are enabled or disabled. If someone accidentally disabled the full-page cache (FPC), every page load hits PHP, which will overload your server under normal traffic.
Check Elasticsearch Connection
# Check Elasticsearch is running and responding
curl -s http://localhost:9200/_cluster/health?pretty
Healthy output shows a "status" : "green" or "status" : "yellow". Red status means your search and category pages are likely broken.
Automate internal health checks:
Create a simple script that runs these CLI checks on a schedule and writes the results to a health endpoint (e.g., /health-check.php). Then monitor that endpoint externally with Notifier. If any internal check fails, the endpoint returns a 503, and you get an alert. This bridges the gap between internal diagnostics and external monitoring.
How to Set Up Magento Monitoring With Notifier
Setting up external monitoring for your Magento store takes about five minutes. Here's the step-by-step process.
Step 1: Create Your Account
Sign up at notifier.so/register. The free plan includes 10 monitors, which is enough to cover the essential Magento endpoints listed above.
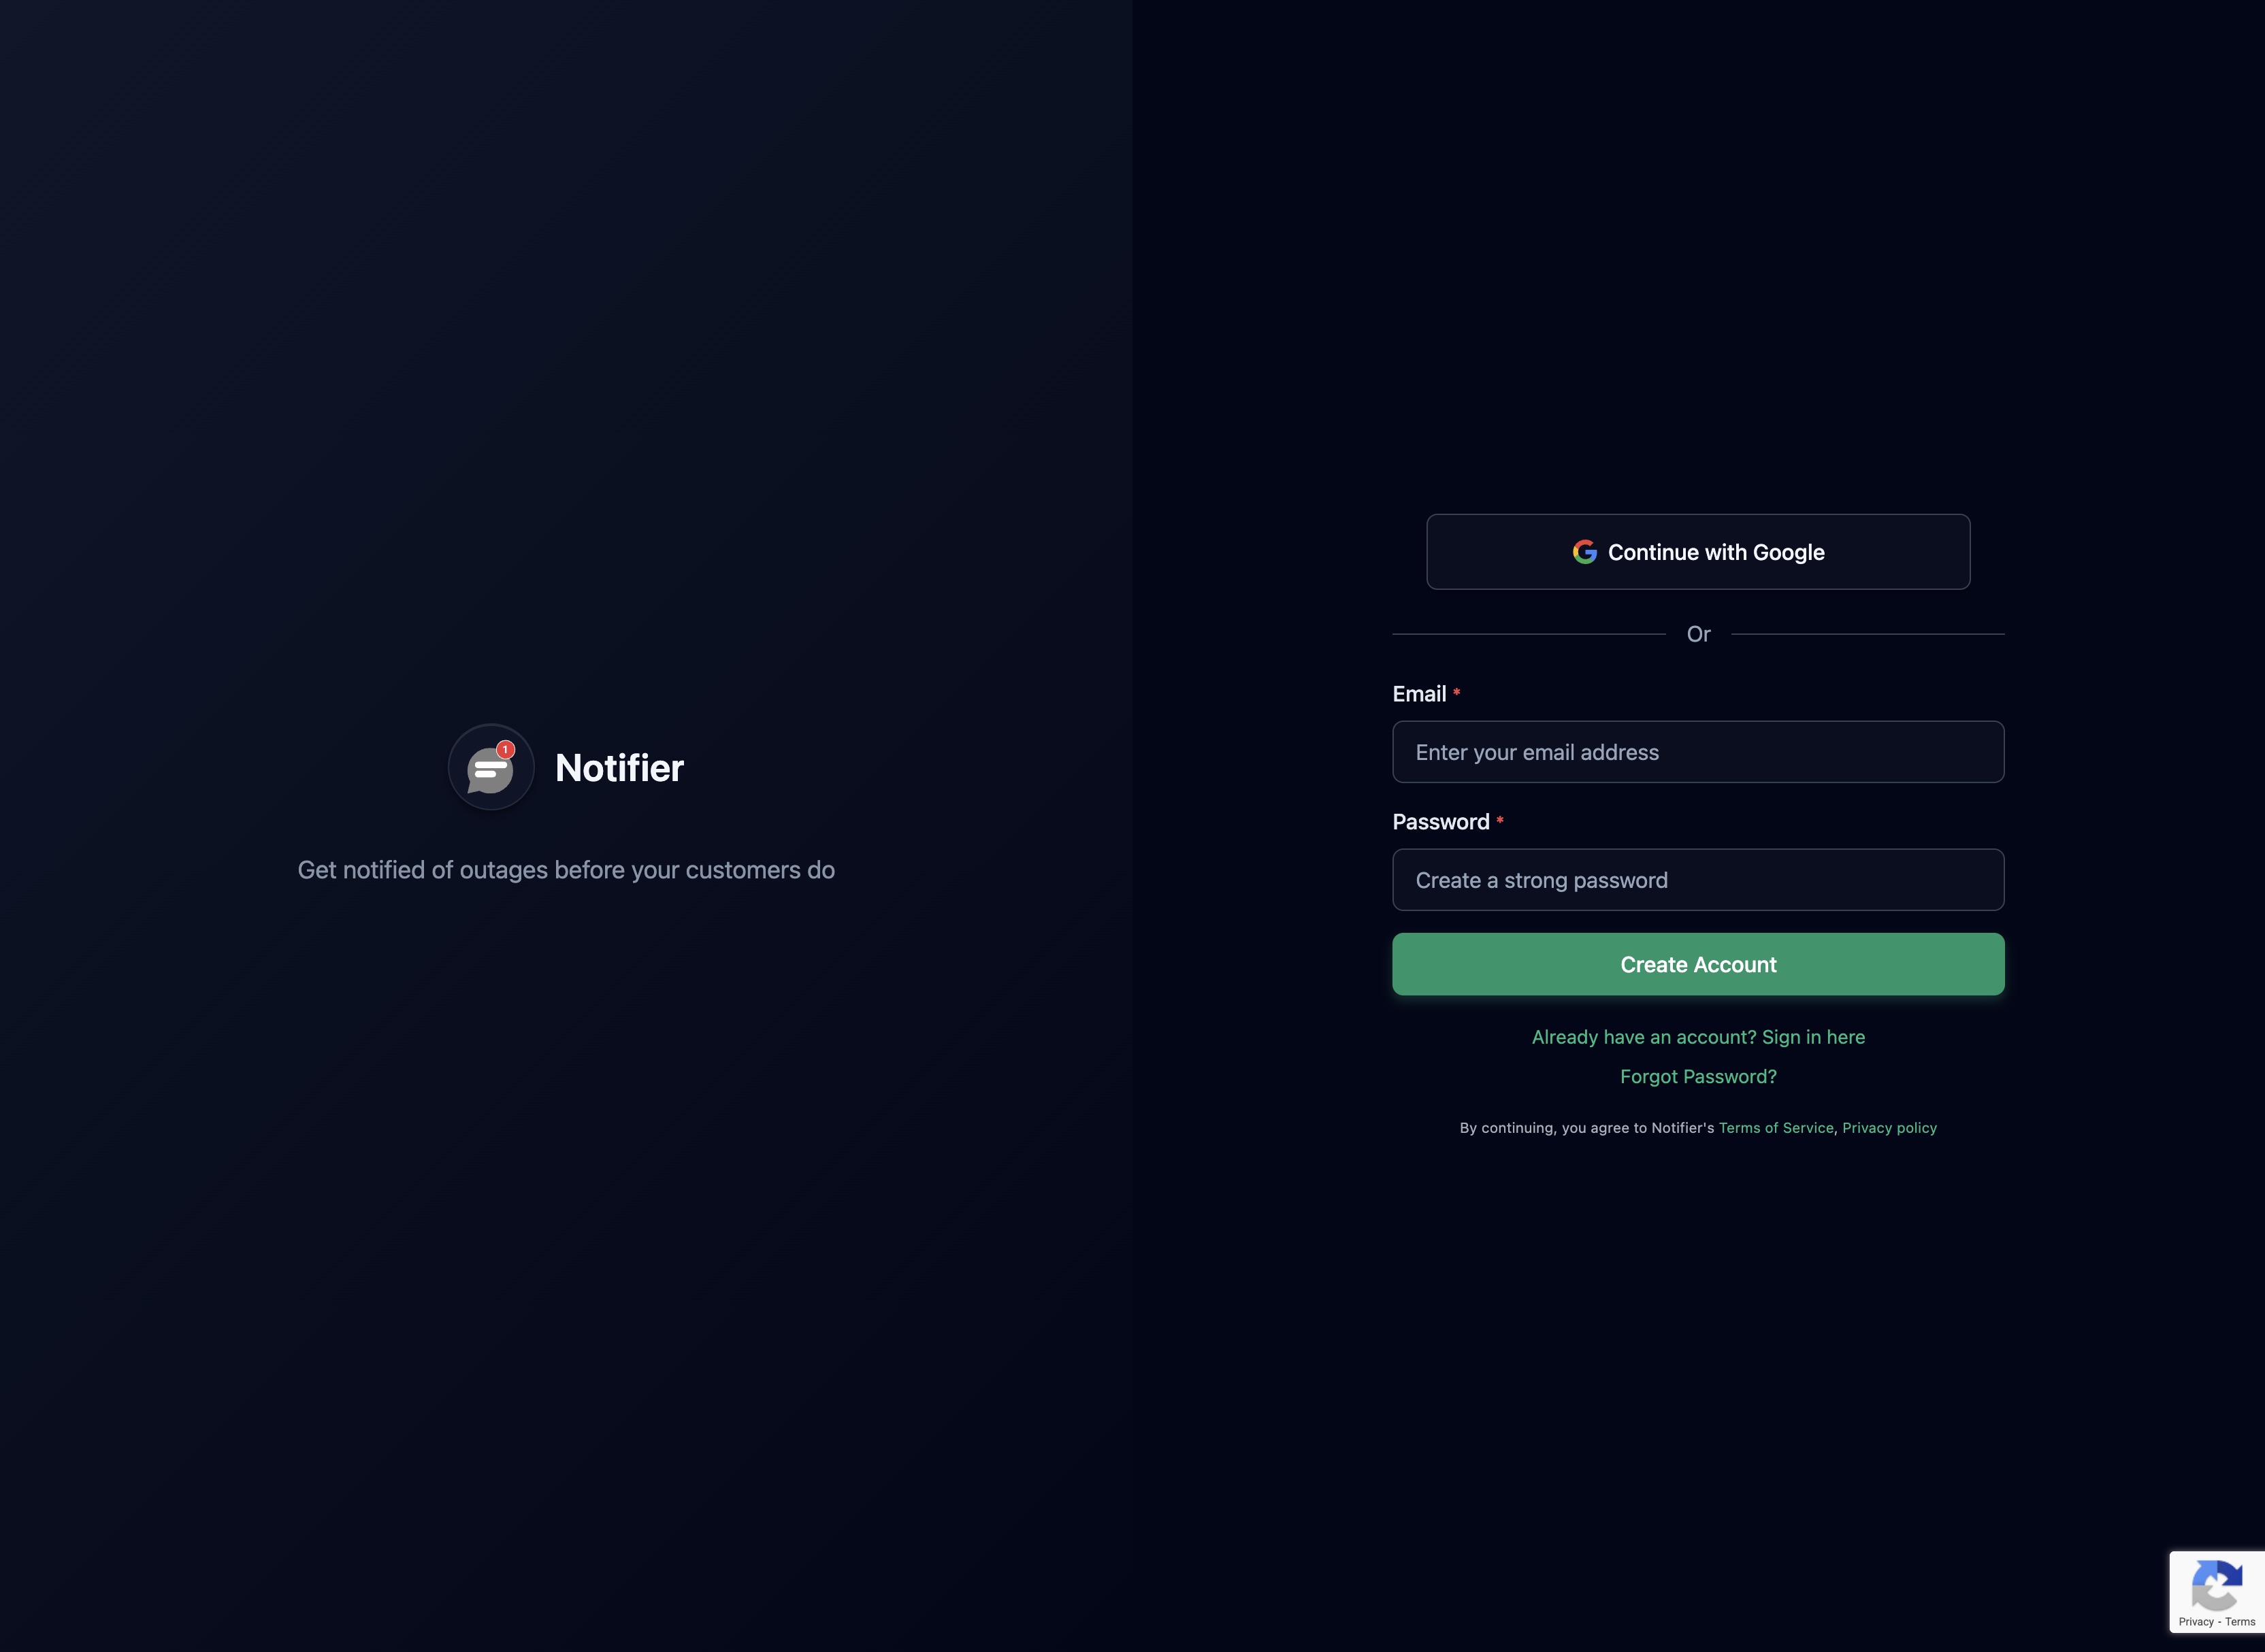
Create a free account to start monitoring your Magento store.
Step 2: Add Your Critical URLs
Add monitors for each of the key Magento URLs. Start with these five:
- 1. Storefront homepage (
https://yourstore.com/) - 2. Checkout page (
https://yourstore.com/checkout/) - 3. A category page (
https://yourstore.com/women.html) - 4. Search results (
https://yourstore.com/catalogsearch/result/?q=test) - 5. Admin panel (
https://yourstore.com/admin/)
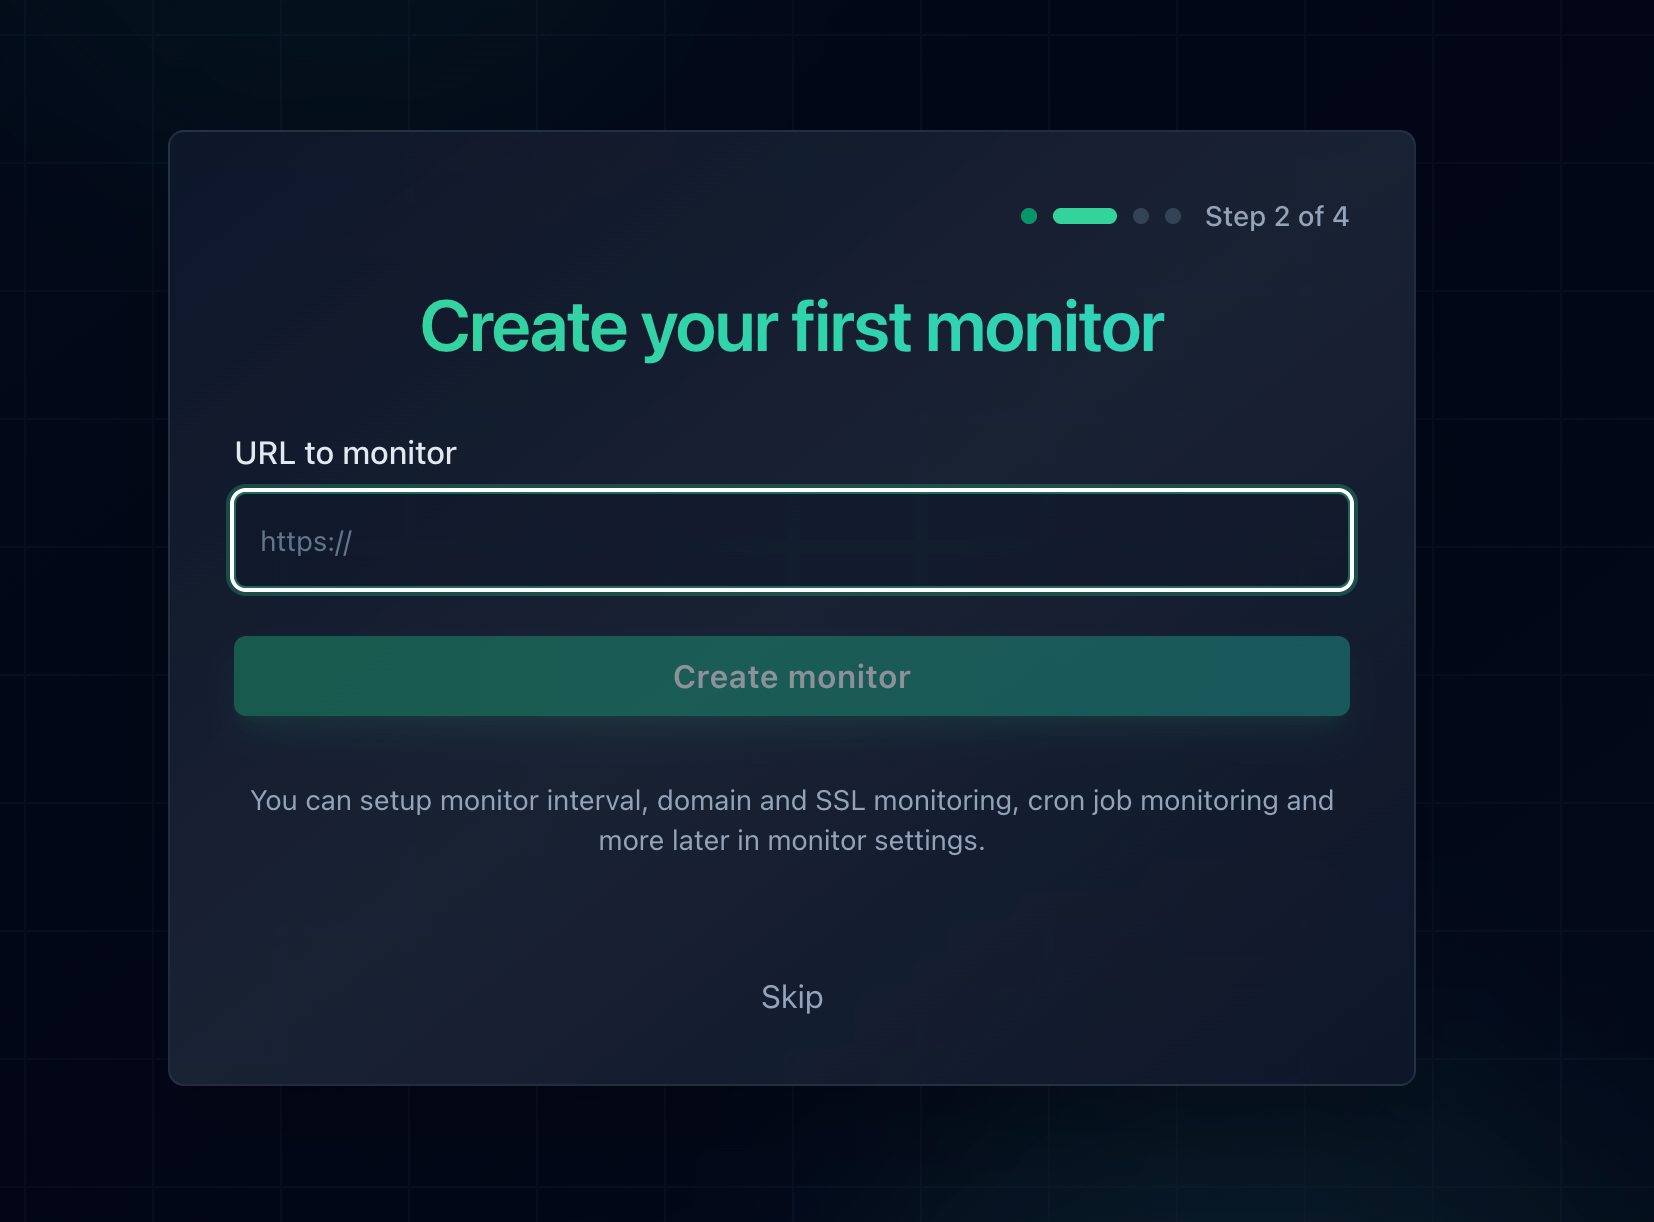
Add each critical Magento URL as a separate monitor.
Step 3: Set Check Intervals
Use 30-second intervals for your checkout page (available on Team and Enterprise plans at $19/month and $35/month). For your homepage and category pages, 1-minute intervals are sufficient (Solo plan at $4/month). The free plan checks every 5 minutes, which is still useful for lower-traffic stores.
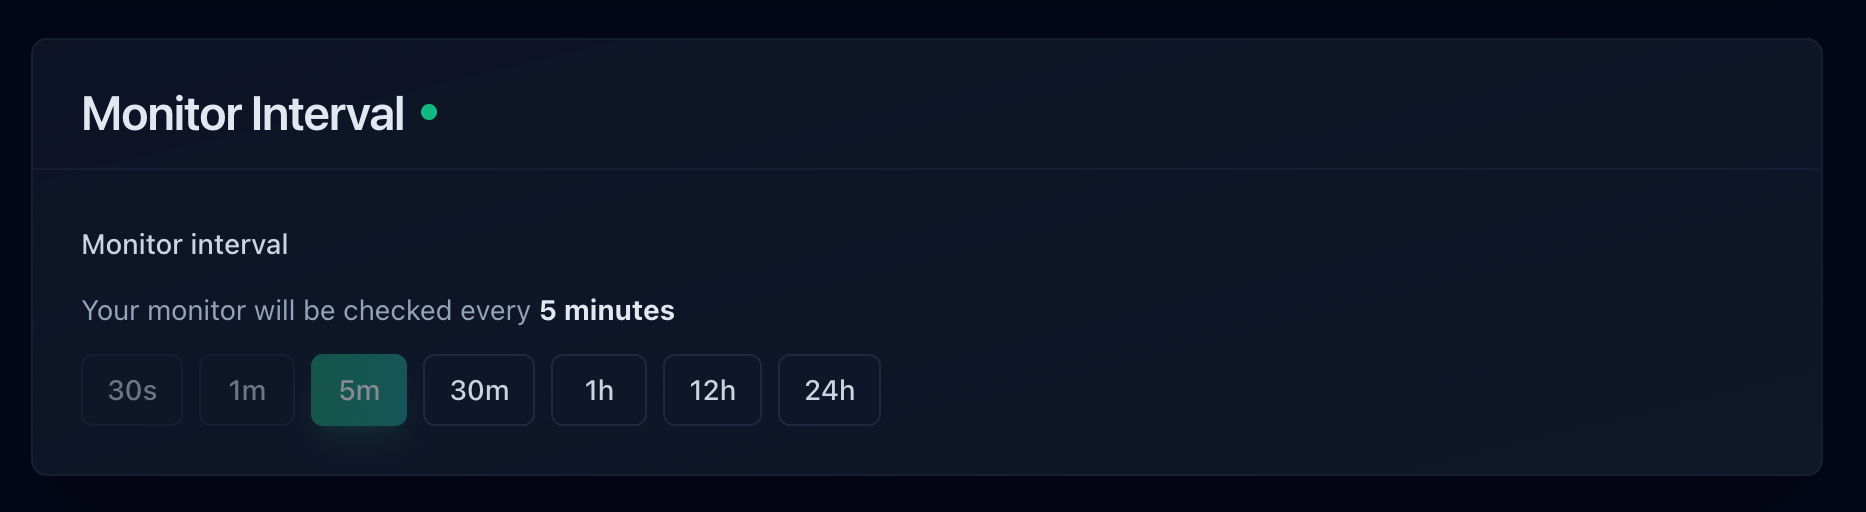
Choose faster intervals for revenue-critical pages like checkout.
Step 4: Configure Alerts
Set up at least two alert channels. Email is the baseline, but for a revenue-generating Magento store, add SMS or phone call alerts so you're notified even when you're away from your inbox. SMS and phone call alerts are available on all plans, including the free tier (credit-based). You can also connect Slack for team notifications.
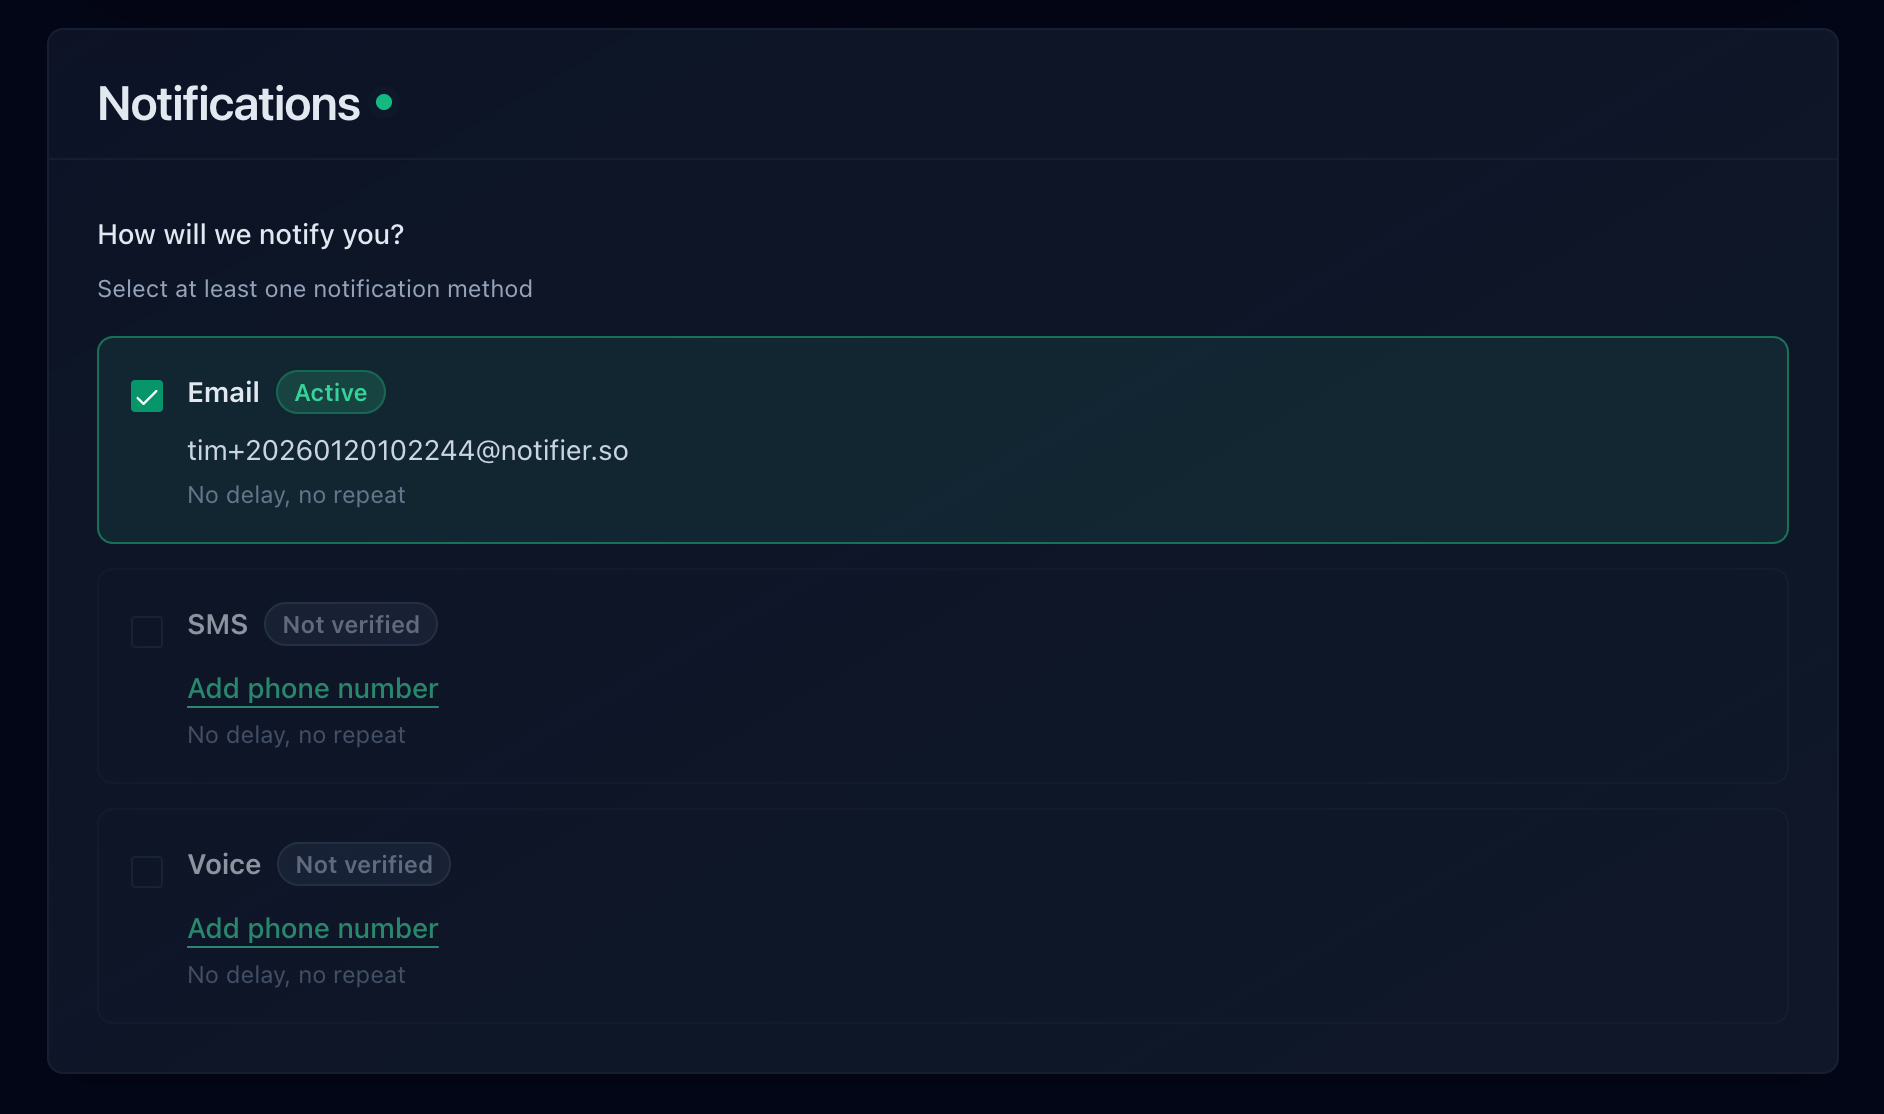
Choose email, SMS, phone call, or Slack alerts for downtime notifications.
Step 5: Create a Status Page
Create a public status page so your customers and support team can check your store's status without contacting you directly. This is especially useful during planned maintenance or major updates. Notifier includes 5 free status pages on the free plan, with custom domain support starting on the Solo plan. For a full walkthrough, see our guide on how to create a status page.
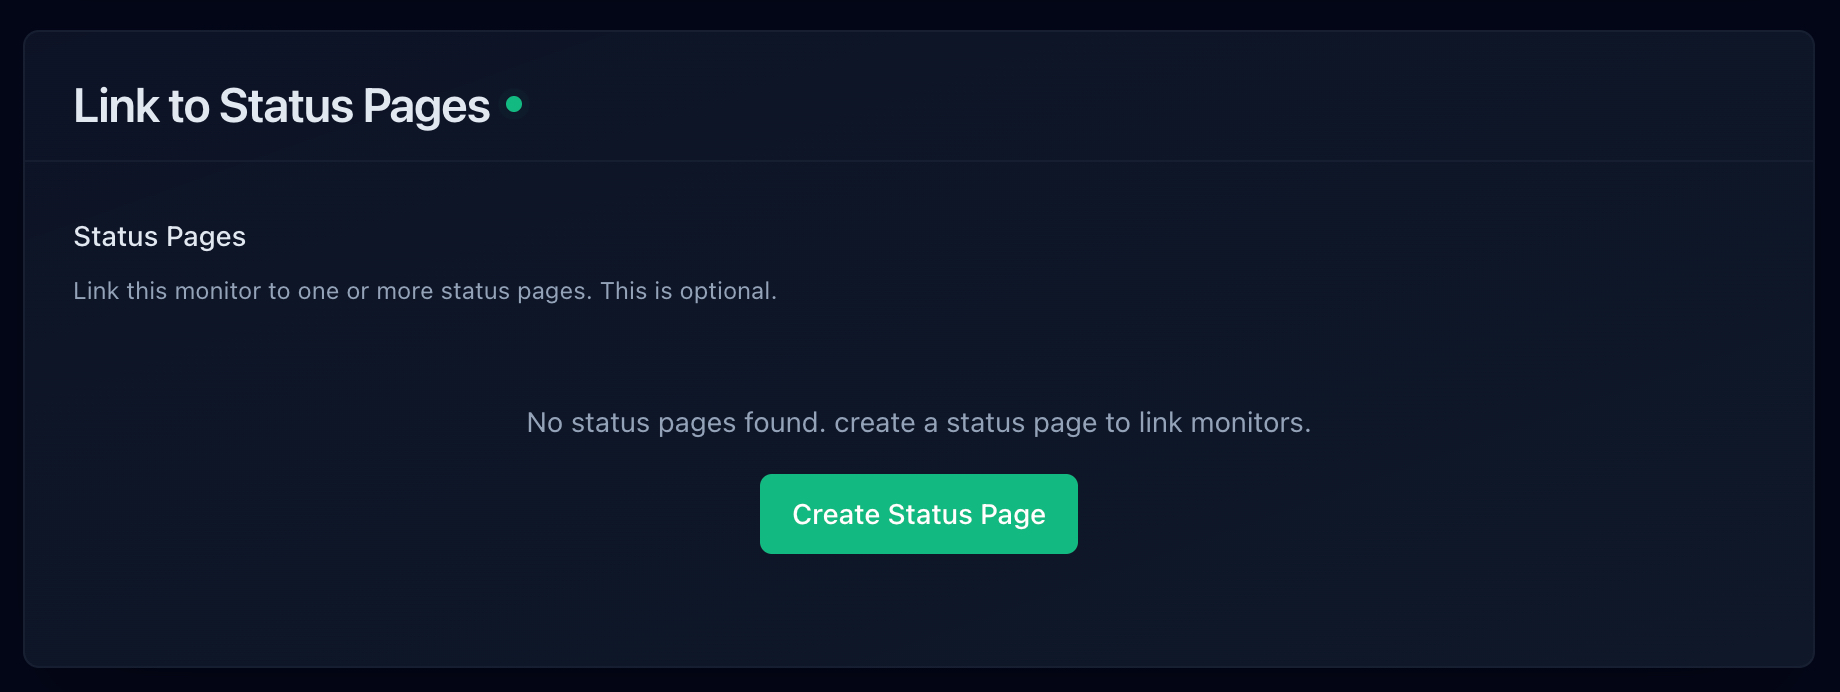
Publish a status page so customers can check your store's health.
Magento's New Relic Integration: External Monitoring as a Complement
Adobe Commerce (Magento Cloud) includes New Relic APM integration. New Relic is a powerful application performance monitoring tool that instruments your PHP code, tracks database queries, and identifies bottlenecks. However, it serves a different purpose than external uptime monitoring.
| Capability | New Relic APM | External Monitoring (Notifier) |
|---|---|---|
| Detects server crashes | Limited (agent stops reporting) | Yes (immediate alert) |
| Detects DNS/SSL failures | No | Yes |
| Identifies slow PHP functions | Yes (detailed traces) | No |
| Database query analysis | Yes | No |
| SMS/phone call alerts | Paid add-on | All plans (credit-based) |
| Public status pages | No | Yes (free) |
| SSL certificate monitoring | No | Yes (free on all plans) |
| Monitors from user's perspective | No (server-side only) | Yes |
| Price | Included with Adobe Commerce Cloud; $99+/month standalone | Free for 10 monitors; $4/month for Solo |
The bottom line: New Relic tells you why your store is slow. External monitoring tells you when your store is down. You need both. New Relic won't alert you when your entire server is unreachable (because the agent can't report if the server is offline). External monitoring won't tell you which PHP function is causing a memory leak. Use New Relic for debugging and optimization, and use Notifier for instant downtime alerts and SSL monitoring.
SSL and Domain Monitoring for Magento Stores
SSL certificates are critical for Magento stores. An expired certificate doesn't just show a browser warning. It completely blocks checkout on most modern browsers, and customers who see a security warning will leave immediately. For Magento stores processing payments, a lapsed SSL certificate can also violate PCI compliance requirements.
Why Magento SSL Failures Happen
- Auto-renewal failures: Let's Encrypt certificates auto-renew, but server misconfigurations, firewall rules, or DNS changes can silently break the renewal process. You won't know until the certificate expires.
- Multi-domain certificates: Magento stores often use separate domains for the storefront, admin panel, and CDN (media). Each domain needs a valid certificate, and it's easy to miss one during renewal.
- CDN certificate mismatch: If you use a CDN like Cloudflare or Fastly in front of Magento, the CDN's SSL certificate needs to match your domain. Misconfigurations here cause intermittent SSL errors that are hard to debug.
- Load balancer configuration: In multi-server Magento setups, SSL termination happens at the load balancer. If the certificate on the load balancer expires but your backend servers still have valid certs, testing from the server won't catch the problem.
Notifier includes SSL certificate monitoring on every plan, including the free tier. It checks your certificate's expiration date and alerts you well before it lapses. For a deep dive, see our SSL certificate monitoring guide.
Domain Expiration
Domain expiration is the most preventable and most catastrophic failure for any online store. If your domain expires, your entire store goes offline. Some registrars offer grace periods, but others release the domain immediately. For Magento stores, this means zero revenue and a potential SEO disaster. Monitor your domain's expiration date and set reminders at 90, 30, and 7 days before expiry. You can use our free domain expiry checker tool for a quick check, or set up automated monitoring with domain expiration monitoring.
Monitoring Tool Comparison for Magento Stores
Here's how the major monitoring tools compare for Magento store monitoring specifically.
| Tool | Free Tier | Min Interval | SSL Monitoring | Status Pages | Best For |
|---|---|---|---|---|---|
| Notifier | 10 monitors | 30 sec | Free on all plans | 5 free | Magento stores that need simple, reliable monitoring with fast alerts |
| UptimeRobot* | 50 monitors | 5 min | Yes | 1 free | Non-commercial use only on free tier |
| Better Stack | 10 monitors | 3 min | Yes | 1 free | Teams that also need incident management |
| New Relic (APM) | 100 GB/month | N/A (internal) | No | No | Deep PHP performance analysis (complement, not replacement) |
| StatusCake | 10 monitors | 5 min | Yes | Paid only | Page speed monitoring alongside uptime |
| Pingdom | No free tier | 1 min | Yes | 1 | Enterprise teams with budget for real user monitoring |
*UptimeRobot's free tier has been restricted to non-commercial use since October 2024. Magento stores are commercial by definition, so you'd need a paid plan.
Freshping was shut down on March 6, 2026. See our Freshping shutdown guide for migration options.
For Magento stores, Notifier offers the best balance of features and simplicity. You get SSL monitoring, status pages, and fast alert channels (including SMS and phone calls) on every plan. The free tier covers up to 10 URLs, which is enough for a typical Magento store's critical endpoints. If you need 30-second check intervals for checkout monitoring, the Team plan at $19/month has you covered.
Frequently Asked Questions
How often should I monitor my Magento store?
For your checkout page, every 30 seconds is ideal because checkout failures directly cost you sales. For your homepage and category pages, every 1 minute is sufficient. For admin panel and search, every 5 minutes works well. The key is matching the check frequency to the revenue impact of each endpoint.
Does Magento have built-in uptime monitoring?
No. Magento does not include any built-in uptime monitoring or downtime alerts. Adobe Commerce Cloud includes New Relic APM integration for performance analysis, but that's an internal monitoring tool that tracks PHP execution, not an external uptime monitor. You need a separate service like Notifier to monitor your storefront from the outside and send alerts when it goes down.
What's the most common cause of Magento downtime?
Memory exhaustion is the single most common cause. Magento 2 is resource-intensive, and when PHP, MySQL, Redis, and Elasticsearch all compete for memory on the same server, the system runs out and PHP processes crash. The second most common cause is Varnish cache failures, which suddenly expose your backend to full traffic load. Third is custom module conflicts after updates.
Should I monitor my Magento admin panel?
Yes. The admin panel uses different PHP processes and routes than the storefront. It can go down independently. If your admin panel is unreachable, you can't process orders, update inventory, or manage your store. Monitor it at a lower frequency (every 5 minutes) since it's not customer-facing, but do monitor it.
How do I monitor Magento search (Elasticsearch) from outside?
The simplest approach is to monitor your catalog search URL directly. Set up a monitor for https://yourstore.com/catalogsearch/result/?q=test and verify it returns a 200 status code. If Elasticsearch is down, this page will return a 500 error or a timeout. This is more reliable than monitoring the Elasticsearch port directly because it tests the full stack from Magento through Elasticsearch and back.
Is New Relic enough for Magento monitoring?
No. New Relic APM is excellent for profiling PHP performance and identifying slow database queries, but it cannot detect external failures like DNS issues, SSL certificate expiration, or complete server unreachability. New Relic's agent runs inside your server, so if the server crashes, the agent stops reporting. You need external monitoring (like Notifier) to detect outages from your customers' perspective. Use both together for complete coverage.
How do I monitor a headless Magento (PWA) setup?
For headless Magento with a PWA frontend (like PWA Studio or Vue Storefront), you need to monitor both layers separately. Monitor the PWA frontend URL for storefront availability, and monitor the Magento REST or GraphQL API endpoints that the frontend calls. A typical setup would include monitors for the PWA homepage, the Magento /rest/V1/store/storeConfigs endpoint, and the GraphQL endpoint at /graphql.
What's the best free monitoring tool for a Magento store?
Notifier offers the most useful free tier for Magento stores: 10 monitors, 5 status pages, SSL certificate monitoring, and email/SMS/phone call alerts. That's enough to cover all critical Magento endpoints. UptimeRobot offers 50 free monitors but restricts its free tier to non-commercial use, which excludes Magento stores. For more options, see our best free monitoring tools comparison.