HTTP / Website Monitor
Monitor any website or endpoint and get alerted when it goes down.
Overview
HTTP monitors check your website by sending a HEAD request to your URL at regular intervals. If the response is healthy, your site is marked as UP. If the request times out, returns an error status code, or fails to connect, it is marked as DOWN.
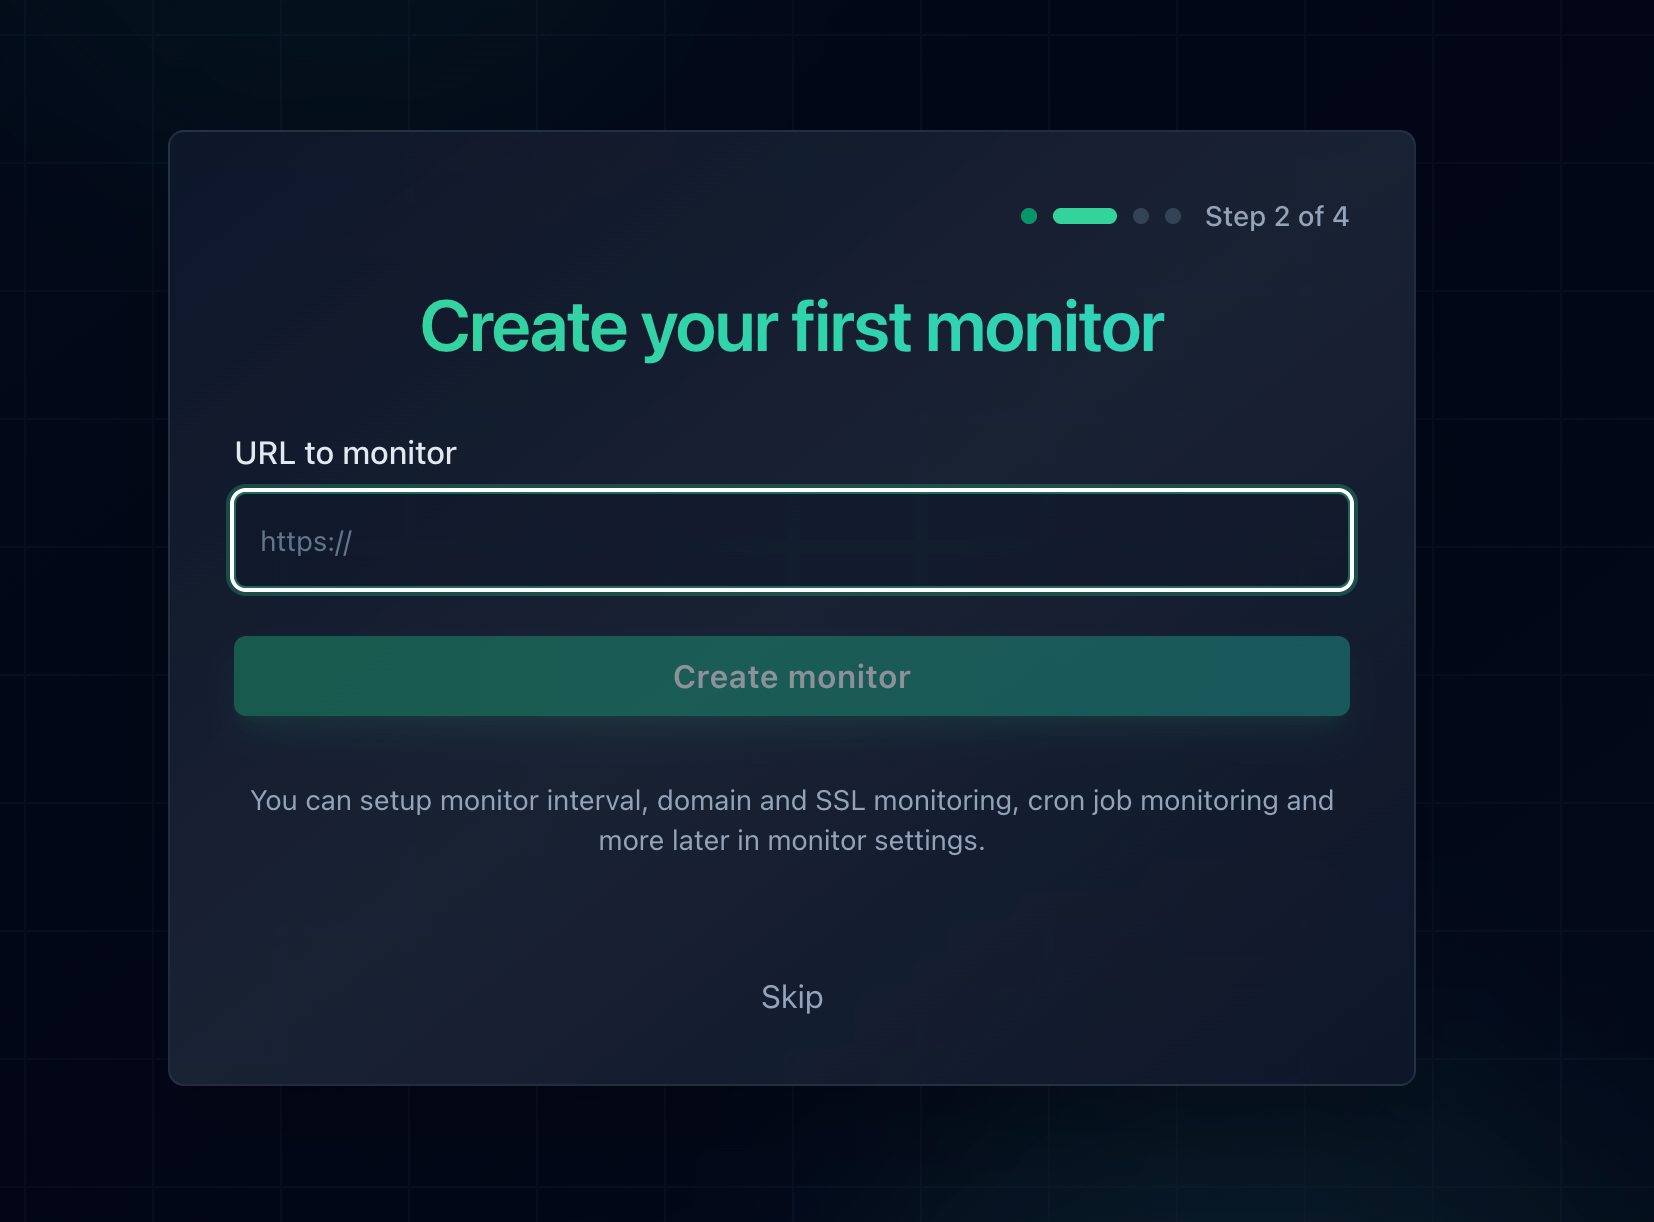
Creating a Monitor
- Click Add Monitor in the dashboard.
- Enter the full URL, including the protocol (e.g.
https://example.com). Bothhttp://andhttps://are supported. - Optionally set a friendly name. If left blank, the URL is used as the display name.
- Select a check interval.
- Choose your alert channels (email, SMS, phone, Slack).
- Optionally assign the monitor to a status page.
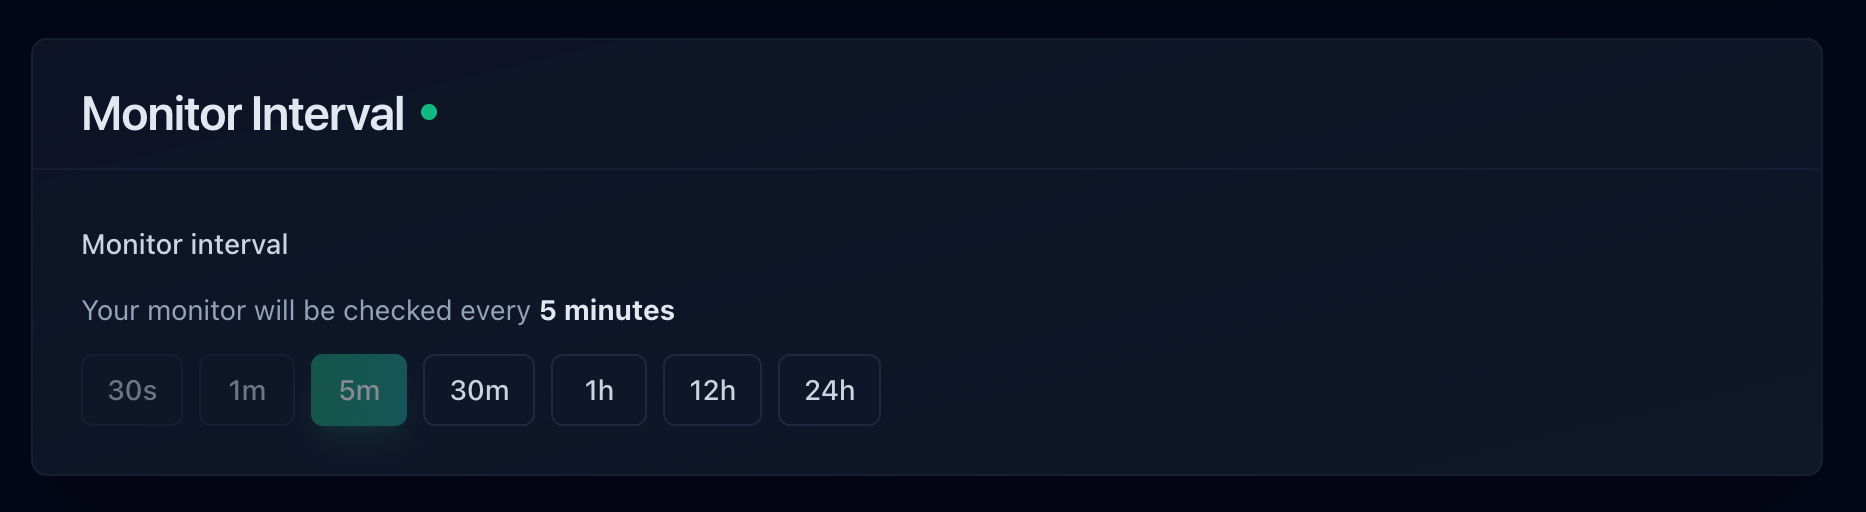
Check Intervals
The check interval controls how often Notifier sends a request to your URL. Faster intervals detect downtime sooner.
| Interval | Available On |
|---|---|
| 30 seconds | Team, Enterprise |
| 1 minute | Solo, Team, Enterprise |
| 5 minutes (default) | All plans |
| 30 minutes | All plans |
| 1 hour | All plans |
| 12 hours | All plans |
| 24 hours | All plans |
How Checks Work
Each check follows this process:
- Notifier sends an HTTP HEAD request to your URL.
- The request has a 25 second timeout.
- Redirects (301, 302) are followed automatically.
- The response status code determines UP or DOWN status.
- Response time is recorded in milliseconds.
Status Code Rules
- 200, 403, 405 = UP
- All other status codes = DOWN
- SSL errors, timeouts, DNS failures, connection refused = DOWN
Why 403 and 405? Some servers block HEAD requests or return 403 for automated traffic. These responses still confirm the server is running and reachable, so Notifier treats them as UP.
Status Transitions
When a monitor's status changes, Notifier takes action automatically:
UP → DOWN
- A new incident is created.
- Downtime alerts are sent to all configured channels.
- The monitor shows a
down_sincetimestamp.
DOWN → UP
- The incident is resolved automatically.
- Recovery alerts are sent to all configured channels.
- The monitor shows an
up_sincetimestamp.
Response Time Tracking
Every successful check records the response time in milliseconds. If the check fails (timeout, connection error), the response time is recorded as null.
You can view response time charts on the monitor detail page. These charts help you spot performance degradation before it becomes a full outage.
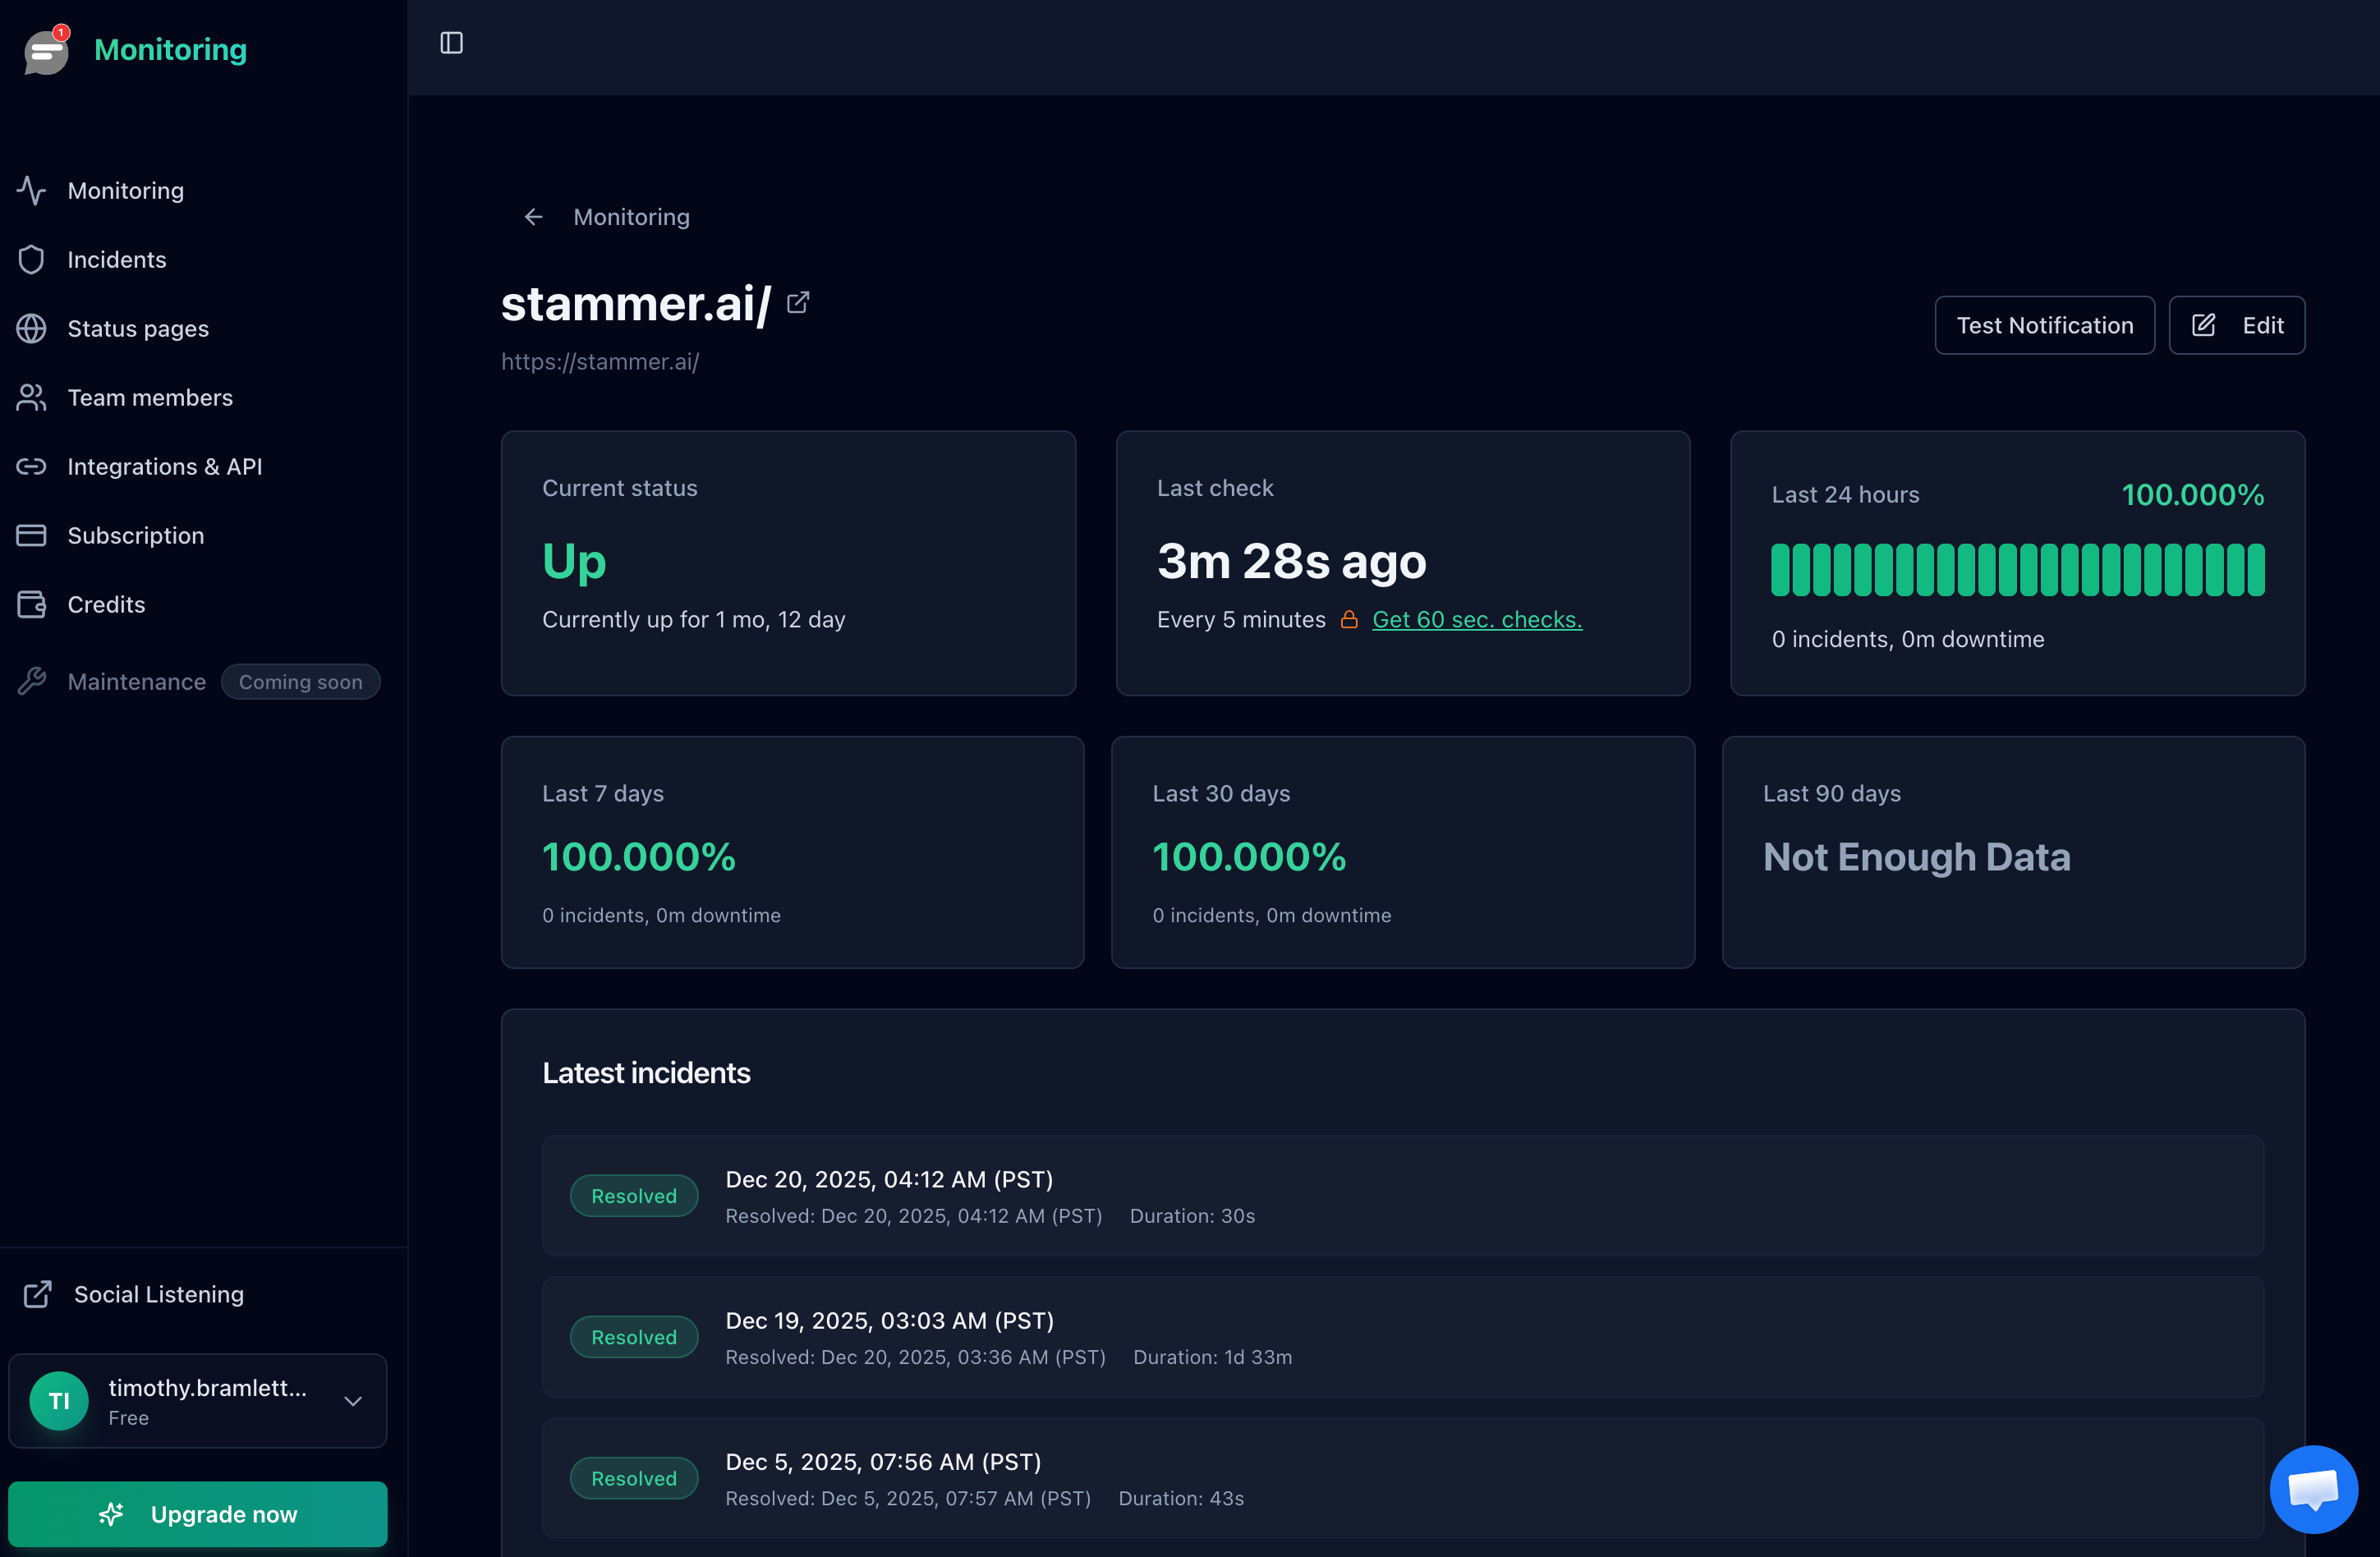
Uptime Statistics
Notifier calculates an uptime percentage from your monitor's check history. This percentage is visible on the monitor detail page and on any status page that includes the monitor.
Managing Monitors
From the monitor detail page you can:
- Edit the URL, name, check interval, or alert settings.
- Pause the monitor. Paused monitors are not checked and will not trigger alerts. Resume at any time.
- Delete the monitor. This removes all associated check history and incidents. This action cannot be undone.