Most website monitoring guides walk you through clicking buttons in a dashboard. That's fine for marketing teams, but as a developer you want more. You want APIs you can call from scripts. Webhooks that trigger your own automation. Checks that run after every deploy. Monitoring that fits into your existing workflow instead of being another tab you have to manage.
This guide covers website monitoring from a developer's perspective. We'll go beyond "sign up and add a URL" to cover health check endpoints, webhook integrations, CI/CD post-deploy verification, content validation, and when building your own monitoring makes sense (spoiler: almost never).
Why Developer Monitoring is Different
A non-technical user needs to know one thing: is my site up or down? Developers need to know more:
- Is the database connected? The homepage might return 200 OK from a cache while your database is unreachable.
- Did the last deploy break anything? You need post-deploy verification, not just periodic checks.
- Are API endpoints returning valid data? A 200 status with an empty response body is still a failure.
- Can I automate the response? When a monitor triggers, you want to kick off a script, restart a service, or page the on-call engineer automatically.
- Does it work from multiple regions? Your CDN might be serving stale content in Asia while Europe works fine.
Basic monitoring tools answer "is the URL responding?" Developer monitoring answers "is the whole system healthy, and what should happen when it isn't?"
Building Health Check Endpoints Worth Monitoring
The first step is giving your monitoring tool something meaningful to check. Instead of monitoring your homepage, create a dedicated health endpoint that verifies your critical dependencies.
A Basic Health Endpoint
Here's a minimal health check in Python (Flask), but the concept applies to any framework:
@app.route('/health')
def health_check():
    return jsonify({"status": "ok"}), 200
This is better than monitoring your homepage because it won't be affected by frontend changes, CDN caching, or marketing page redesigns. But it still only confirms "the web server is running." Let's make it smarter.
A Real Health Endpoint
A production health endpoint should verify your actual dependencies:
@app.route('/health')
def health_check():
    checks = {}

    # Check database
    try:
        db.session.execute(text('SELECT 1'))
        checks['database'] = 'ok'
    except Exception:
        checks['database'] = 'error'

    # Check Redis/cache
    try:
        redis_client.ping()
        checks['cache'] = 'ok'
    except Exception:
        checks['cache'] = 'error'

    # Overall status
    all_ok = all(v == 'ok' for v in checks.values())
    status_code = 200 if all_ok else 503

    return jsonify({
        "status": "ok" if all_ok else "degraded",
        "checks": checks
    }), status_code
Now your monitoring tool can check this endpoint and get a real picture of system health. If the database goes down, the endpoint returns 503 and your monitor triggers an alert. The response body tells you exactly what failed.
Important: Keep health endpoints fast
Your health endpoint will be called every 30 seconds to 5 minutes. Don't run expensive queries or external API calls in it. A SELECT 1 checks database connectivity without loading data. A Redis PING verifies the connection in microseconds. If a dependency check takes more than 500ms, it's too slow for a health endpoint.
What to Monitor with Your Health Endpoint
Point your monitoring tool at /health instead of /. In Notifier, you'd set the monitor URL to https://yoursite.com/health and configure it to alert on any non-200 response.
For extra confidence, you can use keyword monitoring to verify the response contains "status":"ok". That way even if the endpoint returns 200 but the JSON payload indicates a problem, your monitor catches it.
Webhook Callbacks for Custom Automation
Getting an email when your site goes down is table stakes. Developers want webhooks: HTTP callbacks that let you trigger your own code when a monitor's state changes.
What You Can Do with Webhooks
When a monitoring service sends a webhook on downtime, you can:
- Auto-restart services: Trigger a systemd restart or container reboot via your orchestration layer.
- Scale infrastructure: Spin up additional instances if health checks fail due to load.
- Log to your own database: Store incident data in your own system for custom reporting and post-mortems.
- Page on-call engineers: Forward to PagerDuty, Opsgenie, or your own on-call system.
- Update a status page programmatically: Mark a service as degraded without manual intervention.
- Run diagnostic scripts: Automatically collect logs, check disk space, or dump process info when downtime starts.
Example: Receiving a Webhook
Here's a simple webhook receiver in Node.js (Express):
const express = require('express');
const app = express();
app.use(express.json());

app.post('/webhook/monitor', (req, res) => {
    const { monitor_name, status, url, timestamp } = req.body;

    if (status === 'down') {
        console.log(`ALERT: ${monitor_name} is down at ${timestamp}`);
        // Trigger your automation here:
        // - Restart a service
        // - Send a custom notification
        // - Log to your incident database
    }

    if (status === 'up') {
        console.log(`RECOVERED: ${monitor_name} is back up`);
        // Close the incident, update status page, etc.
    }

    res.sendStatus(200);
});

app.listen(3000);
The exact payload format varies by monitoring service. Most include the monitor name, current status (up/down), the URL being monitored, and a timestamp.
Webhook Security
Always verify that incoming webhooks are actually from your monitoring service. Common approaches:
- Shared secret: Include a token in the webhook URL (e.g.,
/webhook/monitor?token=abc123) and validate it server-side. - HMAC signature: Some services sign the payload with a secret key. Verify the signature before processing.
- IP allowlisting: Restrict your webhook endpoint to the monitoring service's IP ranges.
Without verification, anyone who discovers your webhook URL could send fake downtime alerts and trigger your automation.
Post-Deploy Verification in CI/CD
Periodic monitoring checks every 30 seconds to 5 minutes. But if you deploy broken code at 2:03 PM and the next check isn't until 2:05 PM, your users experience two minutes of downtime before you even know. Post-deploy verification closes that gap.
The Simple Approach: curl in Your Pipeline
Add a health check step after your deploy completes:
# GitHub Actions example
- name: Deploy
  run: ./deploy.sh

- name: Verify deployment
  run: |
    sleep 10  # Wait for deploy to propagate
    for i in 1 2 3 4 5; do
      STATUS=$(curl -s -o /dev/null -w "%{http_code}" https://yoursite.com/health)
      if [ "$STATUS" = "200" ]; then
        echo "Health check passed"
        exit 0
      fi
      echo "Attempt $i: got $STATUS, retrying in 5s..."
      sleep 5
    done
    echo "Health check failed after 5 attempts"
    exit 1
This gives you 5 attempts over 35 seconds. If the health endpoint doesn't return 200, the pipeline fails and you know immediately.
Checking Multiple Endpoints
For larger applications, verify more than just the health endpoint:
#!/bin/bash
# post-deploy-check.sh

ENDPOINTS=(
    "https://yoursite.com/health"
    "https://api.yoursite.com/v1/status"
    "https://yoursite.com/login"
)

FAILED=0
for url in "${ENDPOINTS[@]}"; do
    STATUS=$(curl -s -o /dev/null -w "%{http_code}" "$url")
    if [ "$STATUS" != "200" ]; then
        echo "FAIL: $url returned $STATUS"
        FAILED=1
    else
        echo "OK: $url"
    fi
done

exit $FAILED
Run this script as the final step in your CI/CD pipeline. If any endpoint fails, the pipeline reports a failure and you can trigger a rollback.
Combining CI/CD with Continuous Monitoring
Post-deploy checks and continuous monitoring are complementary, not replacements for each other:
- CI/CD checks catch deploy-related issues immediately (within seconds of deploy).
- Continuous monitoring catches issues that develop over time: memory leaks, certificate expirations, third-party service outages, traffic spikes that overwhelm your server.
Use both. Your CI/CD pipeline verifies the deploy worked. A service like Notifier watches everything between deploys.
Beyond HTTP Status Codes
A 200 OK doesn't always mean everything is fine. Here's what else developers should validate.
Response Body Validation
Your API might return 200 with an empty body, or 200 with an error message in the JSON. Keyword monitoring lets you verify the response contains expected content:
- Check that your health endpoint returns
"status":"ok" - Verify your homepage contains a key element (like your brand name or a specific div)
- Confirm your API returns valid JSON with expected fields
Response Time Thresholds
A response that takes 15 seconds is technically "up" but effectively broken for users. Monitor response time and alert when it exceeds a threshold. Most monitoring tools track response time automatically and let you set maximum thresholds.
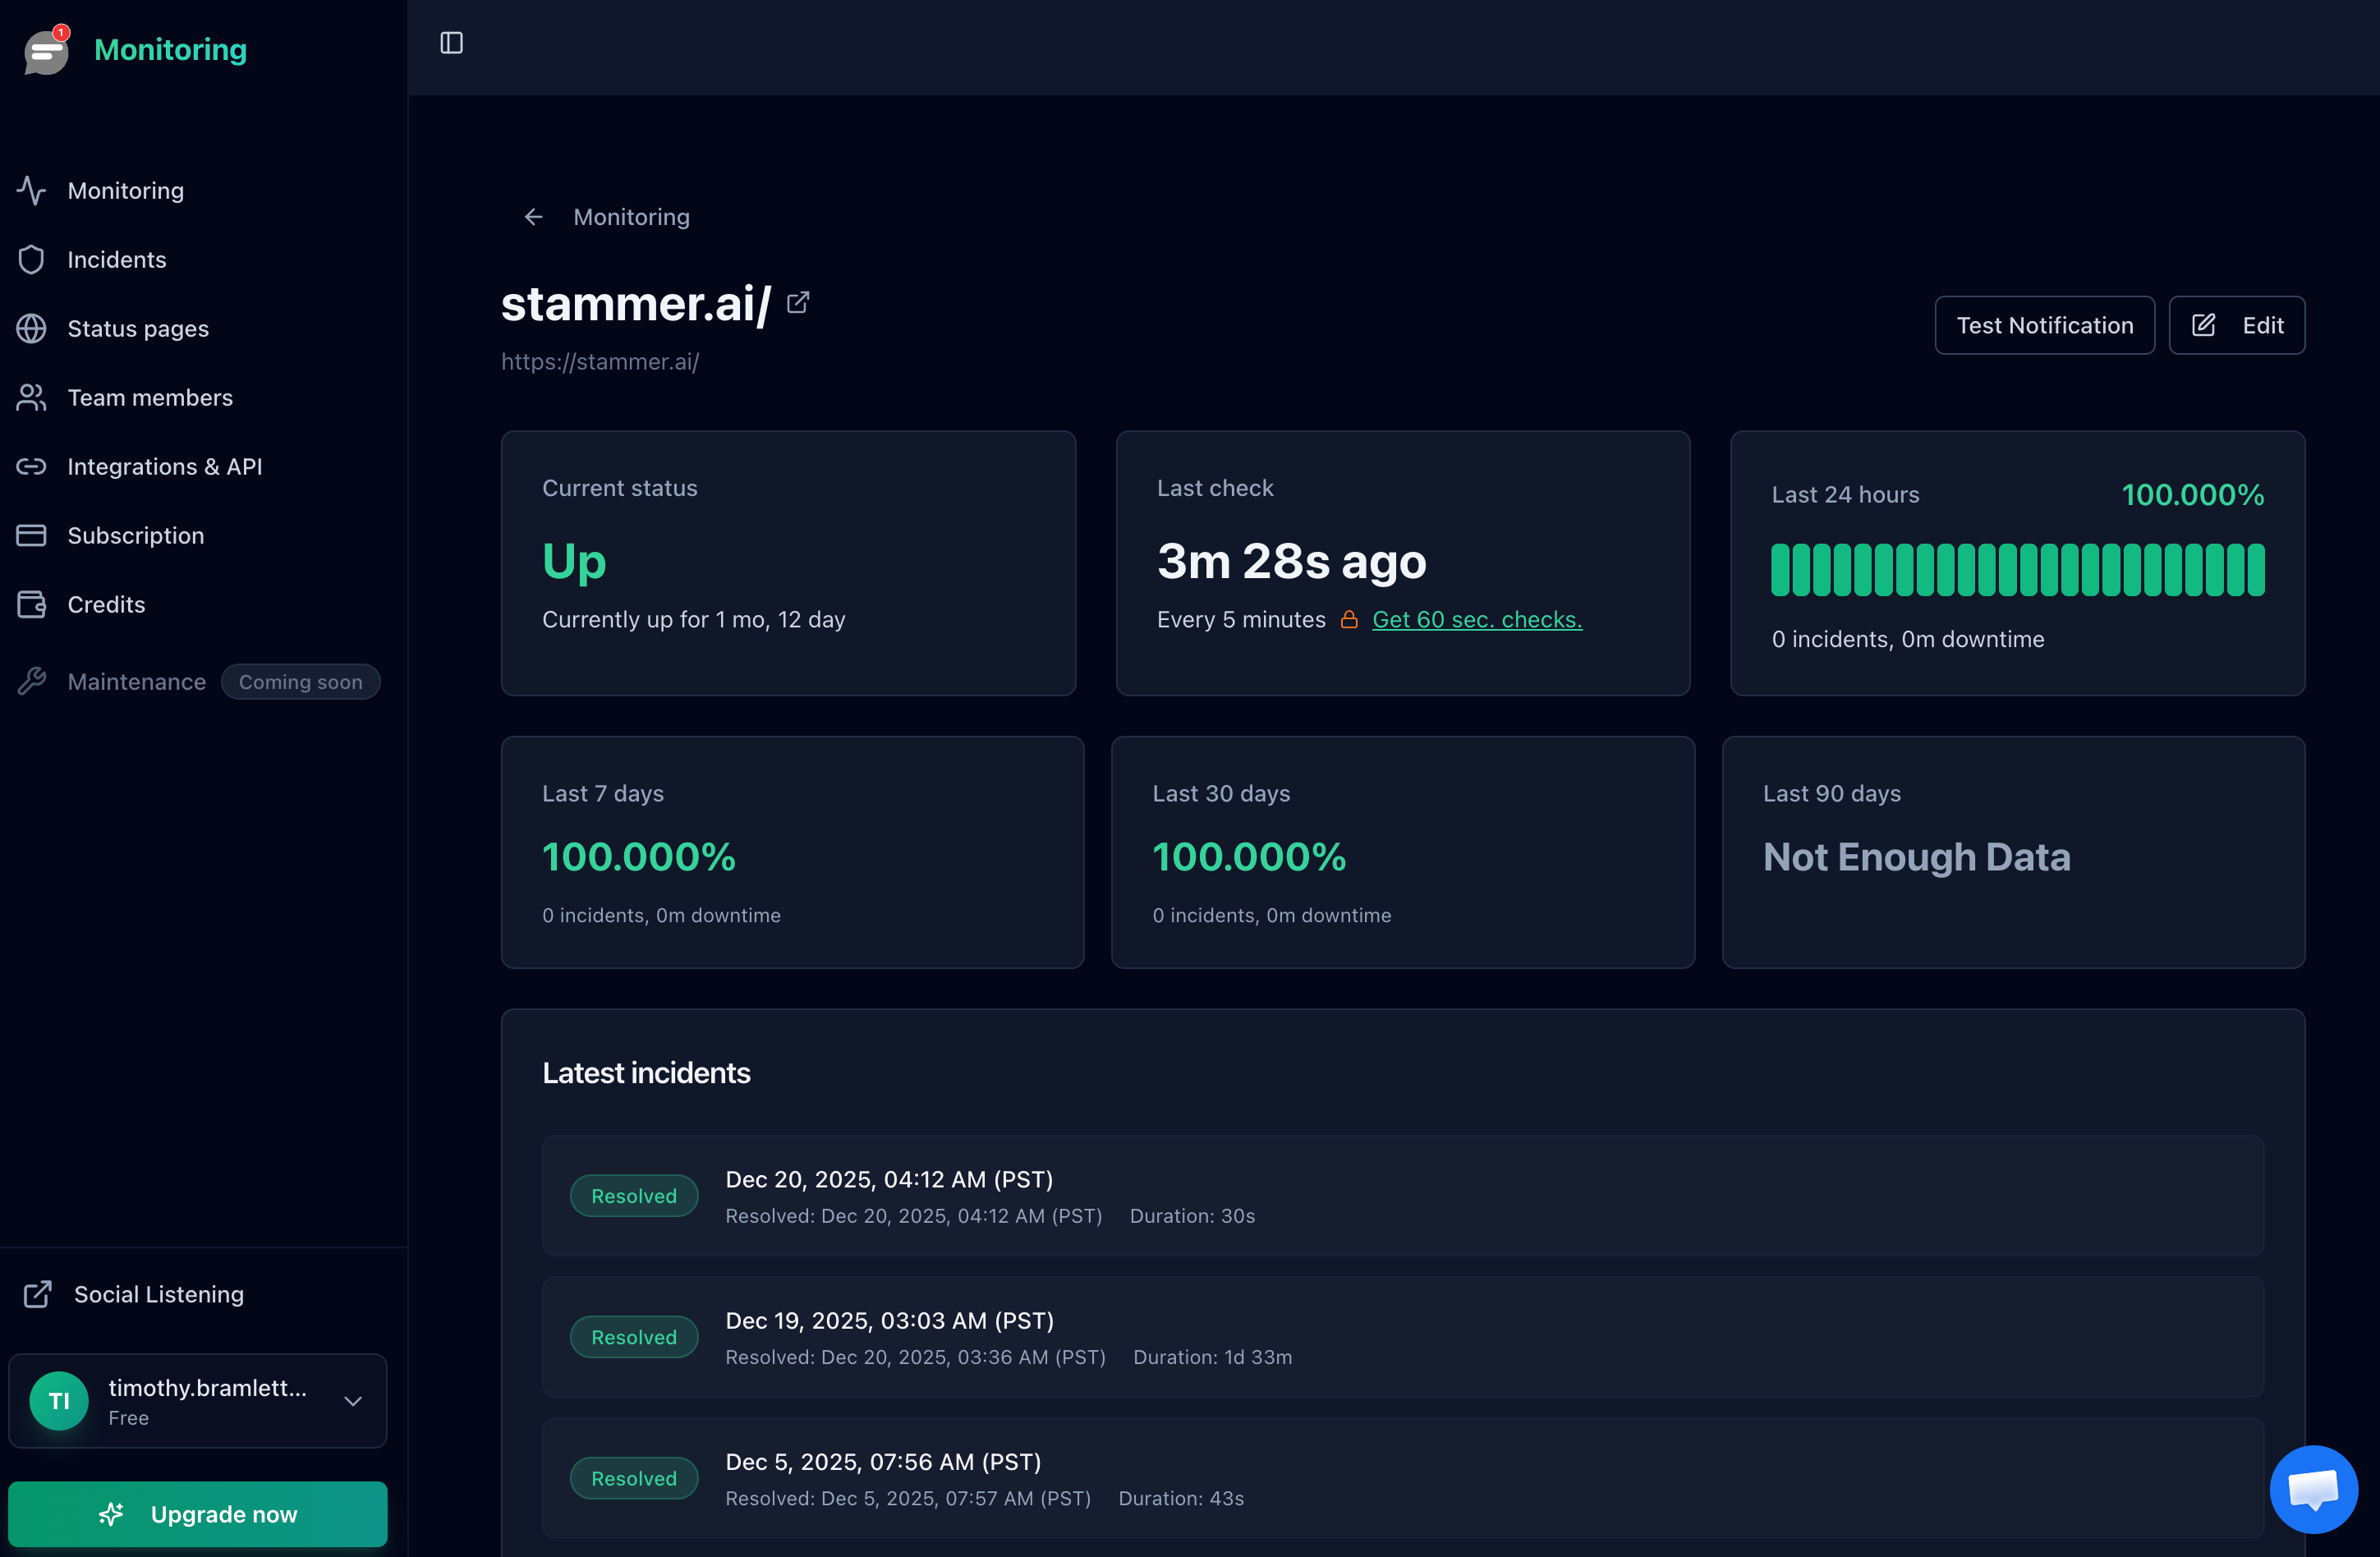
Notifier tracks response time for every check and displays it in the monitor detail view. You can see trends over time, which is useful for catching gradual performance degradation that doesn't trigger a down alert.
SSL Certificate Expiration
An expired SSL certificate takes your site down for all practical purposes. Browsers show scary warnings and users leave immediately. Monitor certificate expiration dates separately from uptime. Most monitoring services include SSL checks, and you can also check manually:
echo | openssl s_client -connect yoursite.com:443 2>/dev/null | \
    openssl x509 -noout -dates
For a deeper dive on SSL monitoring, see our SSL certificate monitoring guide.
Multi-Location Checks
If you're monitoring from a single location, you'll miss regional outages. Your site might be down in Asia but fine in North America. Multi-location monitoring checks from several geographic regions and only alerts when the site is unreachable from multiple locations, which also reduces false positives from network blips.
For more on this topic, see our guide to multi-location uptime checks.
Building Your Own Monitoring (And Why You Probably Shouldn't)
Every developer has the same thought: "I could build this in a weekend." Let's walk through what that looks like.
The "Quick" Script
Here's a basic uptime checker in Python:
import requests
import smtplib
import time

SITES = [
    "https://yoursite.com/health",
    "https://api.yoursite.com/status",
]

def check_sites():
    for url in SITES:
        try:
            r = requests.get(url, timeout=10)
            if r.status_code != 200:
                send_alert(f"{url} returned {r.status_code}")
        except requests.exceptions.RequestException as e:
            send_alert(f"{url} is unreachable: {e}")

def send_alert(message):
    # Send email via SMTP
    server = smtplib.SMTP('smtp.gmail.com', 587)
    server.starttls()
    server.login('you@gmail.com', 'app-password')
    server.sendmail('you@gmail.com', 'you@gmail.com', message)
    server.quit()

while True:
    check_sites()
    time.sleep(60)
That works. For about a week. Then you'll discover the problems.
What You'll Need to Add
Once you deploy this script, you'll quickly realize you also need:
- Retry logic: A single failed check shouldn't trigger an alert. Network blips happen. You need 2 or 3 consecutive failures before alerting.
- Alert deduplication: Without state tracking, you'll get an alert every 60 seconds for the entire duration of an outage. Your inbox will fill up fast.
- Recovery notifications: Knowing when a site goes down is half the story. You also need to know when it comes back up.
- Multiple check locations: Your script runs from one server. If that server has network issues, you'll get false alerts. Real monitoring checks from multiple geographic regions.
- SMS and phone calls: Email alerts are useless at 3 AM. You need SMS or phone call integration, which means integrating with Twilio or a similar service.
- Dashboard and history: You'll want to see uptime percentages, response time trends, and incident history. That's a web application.
- The monitoring server itself: Who monitors your monitoring? If the server running your script goes down, you'll have no idea anything is broken.
When DIY Makes Sense
There are valid cases for running your own monitoring:
- Internal network monitoring: If you need to check services that aren't publicly accessible, external monitoring won't work. Self-hosted tools like Uptime Kuma are great for this.
- Custom protocols: If you're monitoring something that isn't HTTP (proprietary protocols, game servers, IoT devices), you may need custom checks.
- Air-gapped environments: Compliance requirements that prevent external services from accessing your infrastructure.
For everything else, a hosted monitoring service at $4/month will save you days of development time and be more reliable than anything you'd build in a weekend.
Developer-Friendly Monitoring Tools Compared
Not all monitoring tools are built for developers. Here's how the major options compare on features developers care about.
| Tool | API | Webhooks | Open Source | Slack | Starting Price |
|---|---|---|---|---|---|
| Notifier | Beta (request access) | Planned | No | Yes | Free / $4 mo |
| Checkly | Yes (full) | Yes | CLI is open source | Yes | Free / $30 mo |
| Uptime Kuma | Limited | Yes (90+ notifiers) | Yes (self-hosted) | Yes | Free (self-host) |
| UptimeRobot | Yes (full) | Yes | No | Yes | Free / $7 mo |
| Better Stack | Yes (full) | Yes | No | Yes | Free / $25 mo |
| Datadog | Yes (extensive) | Yes | Agent is open source | Yes | $15+ mo |
How to Choose
Your decision depends on what you prioritize:
- Maximum API control and monitoring as code: Checkly is purpose-built for this. You write checks in JavaScript/TypeScript and manage them via CLI or Terraform. The tradeoff is complexity and price ($30/month for paid plans).
- Self-hosted and open source: Uptime Kuma gives you full control and costs nothing except hosting. You're responsible for keeping it running, which is ironic for a monitoring tool.
- Simple, affordable, and growing: Notifier is the best option if you want reliable monitoring without enterprise complexity. The API is currently in beta, and the team is actively building it out based on developer feedback. If API access matters to you, reach out to support@notifier.so to request beta access and help shape what gets built. At $4/month for the Solo plan, it's hard to beat on value.
- Full observability platform: Datadog does everything (logs, APM, infrastructure, uptime) but pricing scales fast. Only makes sense if you already use Datadog for other things.
A Note on Notifier's API
Notifier's API is currently in beta. If you're a developer who wants to manage monitors programmatically, create monitors from scripts, or build integrations, the team wants to hear from you. Email support@notifier.so to request beta API access. Since Notifier is built by a small team, you'll get direct access to the developers building it, and your feedback will shape the API's direction.
FAQ
What's the best open source monitoring tool for developers?
Uptime Kuma is the most popular self-hosted option. It's easy to deploy (one Docker command), has a clean UI, and supports over 90 notification channels. The downside is that you're responsible for hosting and maintaining it, and if your monitoring server goes down, you won't know about it. For most developers, combining a free hosted service like Notifier for external checks with Uptime Kuma for internal checks gives you the best of both worlds.
Can I monitor localhost or internal services with external monitoring?
No. External monitoring services can only check publicly accessible URLs. For internal services, localhost endpoints, or services behind a firewall, you need a self-hosted solution like Uptime Kuma or a custom script running inside your network. Some enterprise tools offer agents that run inside your network and report to the cloud service, but that adds complexity and cost.
How often should I check my production site?
For most production sites, 1 minute intervals are a good balance. 30 second checks are better if you have strict SLAs. 5 minute intervals are fine for non-critical services. The faster the check interval, the faster you'll know about downtime. Notifier's Solo plan ($4/month) includes 1 minute checks, and the Team plan ($19/month) goes down to 30 seconds.
Should I use webhooks or polling to check monitor status?
Webhooks are better in almost every case. With polling, your system has to repeatedly call the monitoring service's API asking "has anything changed?" With webhooks, the monitoring service pushes updates to you instantly when something happens. Webhooks are more efficient, lower latency, and don't require you to manage polling intervals or rate limits.
What should my health check endpoint return?
At minimum, return a 200 status with a JSON body like {"status": "ok"}. For production systems, include checks for critical dependencies (database, cache, external APIs) and return 503 if any dependency is down. Keep the endpoint fast (under 500ms). Don't include sensitive information like database credentials or internal IPs in the response.
How do I avoid false alerts from network blips?
Use a monitoring service that checks from multiple locations and requires failures from more than one location before alerting. This eliminates false positives from temporary network issues between the monitoring server and your site. Most hosted services do this automatically. If you're self-hosting, you'd need to set up monitoring from at least two separate servers in different networks.