Your website might load perfectly while your API is returning errors. A health check endpoint might return 200 OK while the underlying database connection is broken. API monitoring is different from website monitoring, and getting it wrong means your users discover problems before you do.
According to the Uptrends State of API Reliability Report, average API uptime fell from 99.66% in 2024 to 99.46% in 2025. That's a 60% increase in downtime. Over 60% of API incidents go undetected until users report them. This guide covers how to set up API monitoring that actually catches problems.
Why API Monitoring is Different
Website monitoring checks if a page loads. API monitoring is more complex because:
- APIs require authentication: Most APIs need API keys, OAuth tokens, or other credentials. A monitoring tool needs to send valid authentication with each request.
- Status codes aren't enough: An API can return 200 OK while sending corrupted data, empty arrays, or error messages in the response body. You need to validate the actual content.
- Dependencies matter: Your API might work fine while a downstream service it depends on is failing. Good monitoring catches these cascading failures.
- Performance is critical: A slow API degrades the entire user experience. Response time monitoring is as important as uptime monitoring.
The Cost of API Downtime
According to a 2024 Enterprise Management Associates study, the average cost of unplanned downtime is $14,056 per minute, rising to $23,750 per minute for large enterprises. Organizations with proactive monitoring achieve 50% faster recovery times.
What to Monitor
Effective API monitoring tracks several key metrics:
Availability (Uptime)
The most basic metric: is the API reachable and responding? This is typically measured as a percentage (99.9%, 99.99%, etc.) and often tied to SLAs. Check our uptime percentage guide for details on what these numbers mean.
Response Time (Latency)
How fast does the API respond? Latency includes several phases:
- DNS resolution: Time to look up the domain
- TCP connection: Time to establish the connection
- TLS handshake: Time for SSL/TLS negotiation
- Time to First Byte (TTFB): Time until the first byte of the response arrives (this often indicates backend processing time)
- Content transfer: Time to download the full response
Prolonged TTFB often indicates backend processing issues like slow database queries or inefficient code.
Error Rate
Track the percentage of requests that return errors (4xx and 5xx status codes). A rising error rate is often the first sign of a failing deployment or broken dependency.
Functional Correctness
Beyond status codes, does the API return correct data? A 200 status code with corrupted JSON or an empty array where data should exist is still a failure. This is sometimes called "functional uptime."
Throughput
Requests per minute (RPM) helps track traffic patterns and identify unusual load. A sudden drop might indicate a problem upstream; a sudden spike might indicate a DDoS attack or runaway client.
Building Health Check Endpoints
The standard approach for API monitoring is a dedicated health check endpoint. This gives monitoring tools a reliable target that reflects the true state of your service.
Basic Health Endpoint
A minimal health endpoint returns 200 if the service is running:
GET /health
HTTP/1.1 200 OK
Content-Type: application/json

{
  "status": "healthy",
  "timestamp": "2026-02-01T12:00:00Z"
}
This tells you the process is running, but not much else. A more useful endpoint checks dependencies.
Comprehensive Health Endpoint
A better approach verifies that the service can actually do its job:
GET /health
HTTP/1.1 200 OK
Content-Type: application/json

{
  "status": "healthy",
  "timestamp": "2026-02-01T12:00:00Z",
  "version": "1.4.2",
  "checks": {
    "database": {
      "status": "healthy",
      "latency_ms": 12
    },
    "redis": {
      "status": "healthy",
      "latency_ms": 2
    },
    "external_api": {
      "status": "healthy",
      "latency_ms": 145
    }
  }
}
If any dependency fails, return a 500 or 503 status:
GET /health
HTTP/1.1 503 Service Unavailable
Content-Type: application/json

{
  "status": "unhealthy",
  "timestamp": "2026-02-01T12:00:00Z",
  "checks": {
    "database": {
      "status": "unhealthy",
      "error": "Connection timeout"
    },
    "redis": {
      "status": "healthy",
      "latency_ms": 2
    }
  }
}
Health Endpoint Best Practices
-
Disable caching: Add
Cache-Control: no-cacheto ensure every request returns fresh status. - Keep it fast: Health checks should complete in under 1 second. Don't run expensive queries.
- Check what matters: Verify database connections, cache connections, and critical external services.
- Don't expose secrets: The health endpoint shouldn't reveal sensitive information like connection strings or internal IPs.
- Consider authentication: For internal APIs, you might require auth even for health checks. For public APIs, an unauthenticated health endpoint is usually fine.
Monitoring Authenticated APIs
Most APIs require authentication. Your monitoring tool needs to send valid credentials with each check.
API Keys
The simplest approach. The monitoring tool includes an API key in the header or query parameter:
GET /api/v1/users
Authorization: Bearer your-api-key-here
Create a dedicated API key for monitoring with read-only permissions. Don't use production keys with write access.
OAuth Tokens
More complex APIs use OAuth. Some monitoring tools support OAuth flows, but many don't. Options include:
- Use a long-lived token if your API supports them
- Create a service account with permanent credentials
- Build a proxy that handles token refresh
Basic Auth
For internal APIs, HTTP Basic Authentication is simple and supported by most tools:
GET /api/internal/status
Authorization: Basic dXNlcm5hbWU6cGFzc3dvcmQ=
Custom Headers
Some APIs use custom headers for authentication. Most monitoring tools let you configure custom headers:
GET /api/data
X-API-Key: your-key-here
X-Client-ID: monitoring-service
Validating API Responses
Checking for a 200 status code isn't enough. An API can return 200 while being fundamentally broken.
Content Type Validation
Verify the response is the expected format. If your API returns JSON, check that the Content-Type header is application/json.
Response Body Validation
Check that the response contains expected content. Common approaches:
-
Keyword matching: Verify the response contains a specific string (e.g.,
"status": "ok") - JSON path validation: Check that specific fields exist and have expected values
- Schema validation: Verify the response matches a JSON schema
Example: Keyword Monitoring
The simplest validation checks for a keyword in the response:
# Expected response
{
  "status": "healthy",
  "database": "connected"
}

# Monitor checks for: "healthy"
# If "healthy" is not in the response, alert
This catches cases where the API returns 200 but with an error message or unexpected state.
API Monitoring Tools
Here are the main options for API uptime monitoring:
Notifier.so
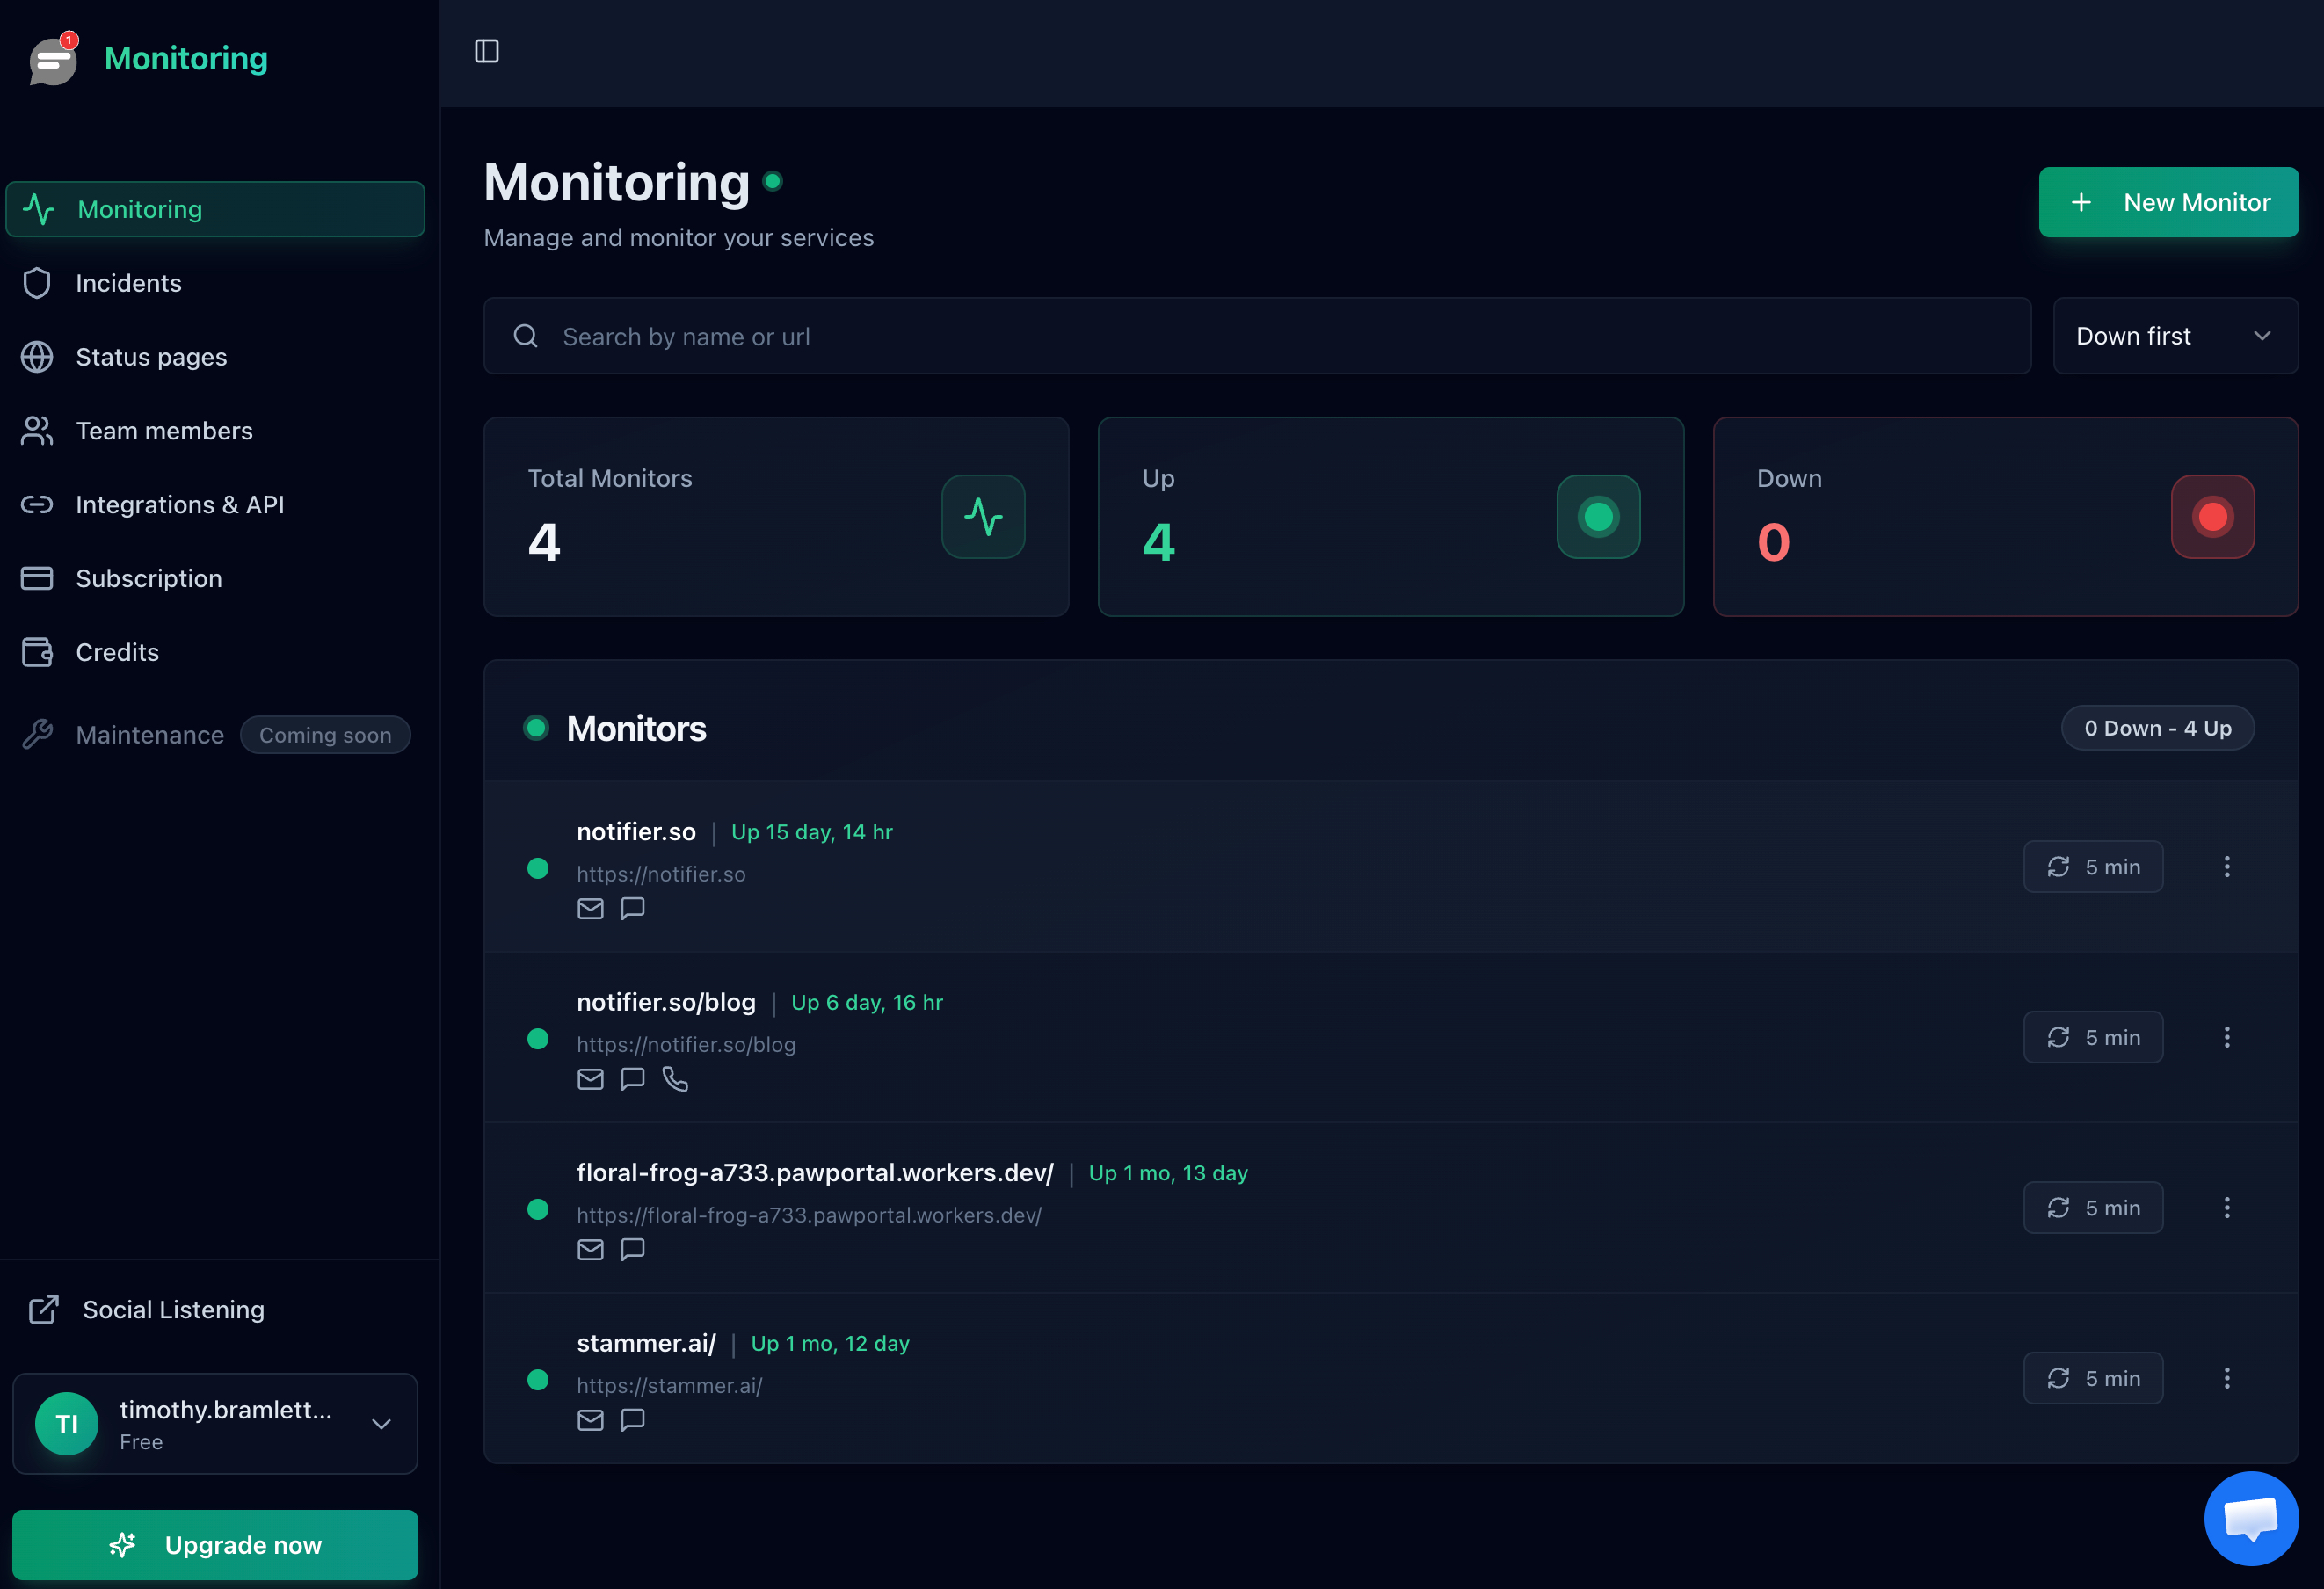
Notifier handles HTTP/HTTPS monitoring with custom headers for API authentication. You can set expected status codes and monitor response times. Simple setup, affordable pricing.
- Free: 10 monitors, 5 min intervals
- Solo ($4/mo): 20 monitors, 1 min intervals
- Team ($19/mo): 100 monitors, 30 sec intervals
Better Stack
Comprehensive monitoring with API checks, incident management, and on-call scheduling. Supports multi-step API transactions. More expensive but includes advanced features.
- Free: 10 monitors, 3 min intervals
- Team ($25/mo): 25 monitors, 30 sec intervals
Postman Monitors
If you already use Postman for API development, their monitoring feature runs your existing collections on a schedule. Supports REST, SOAP, GraphQL, and more.
- Free: 1,000 API calls/month
- Paid ($14+/mo): More calls and team features
Site24x7
Full observability platform with REST API monitoring. Supports custom API checks, response validation, and multi-step transactions. Part of the Zoho ecosystem.
- Starts at $9/mo
Datadog / New Relic
Enterprise APM platforms with comprehensive API monitoring. Include distributed tracing, which helps debug API issues across microservices. Expensive but powerful.
- Typically $5 to 69/month per host
Open Source: Prometheus + Grafana
For teams that want full control, Prometheus collects metrics while Grafana provides dashboards and alerting. Requires setup and maintenance but offers complete flexibility.
Setting Up API Monitoring
Here's a practical approach to getting started:
Step 1: Identify Critical Endpoints
Not all endpoints are equally important. Prioritize by business value:
- Critical: Authentication, checkout, payment processing
- High: Core product functionality, data retrieval
- Medium: Secondary features, analytics
- Low: Documentation, admin endpoints
Monitor critical endpoints more aggressively (faster intervals, more locations).
Step 2: Add Health Check Endpoints
If you haven't already, add a /health endpoint to your API that checks critical dependencies. This is the most reliable monitoring target.
Step 3: Configure Monitors
Set up monitors for your health endpoint and critical business endpoints:
- Create a new HTTP/HTTPS monitor
- Enter the endpoint URL
- Add authentication headers if required
- Set expected status code (usually 200)
- Optionally add keyword validation
- Choose check interval (1 min for critical, 5 min for others)
Step 4: Set Up Alerts
Configure alerts that reach the right people:
- Email: Good for non-urgent issues
- Slack: Team visibility, good for medium priority
- SMS/Phone: For critical production issues
- PagerDuty/Opsgenie: For on-call rotations
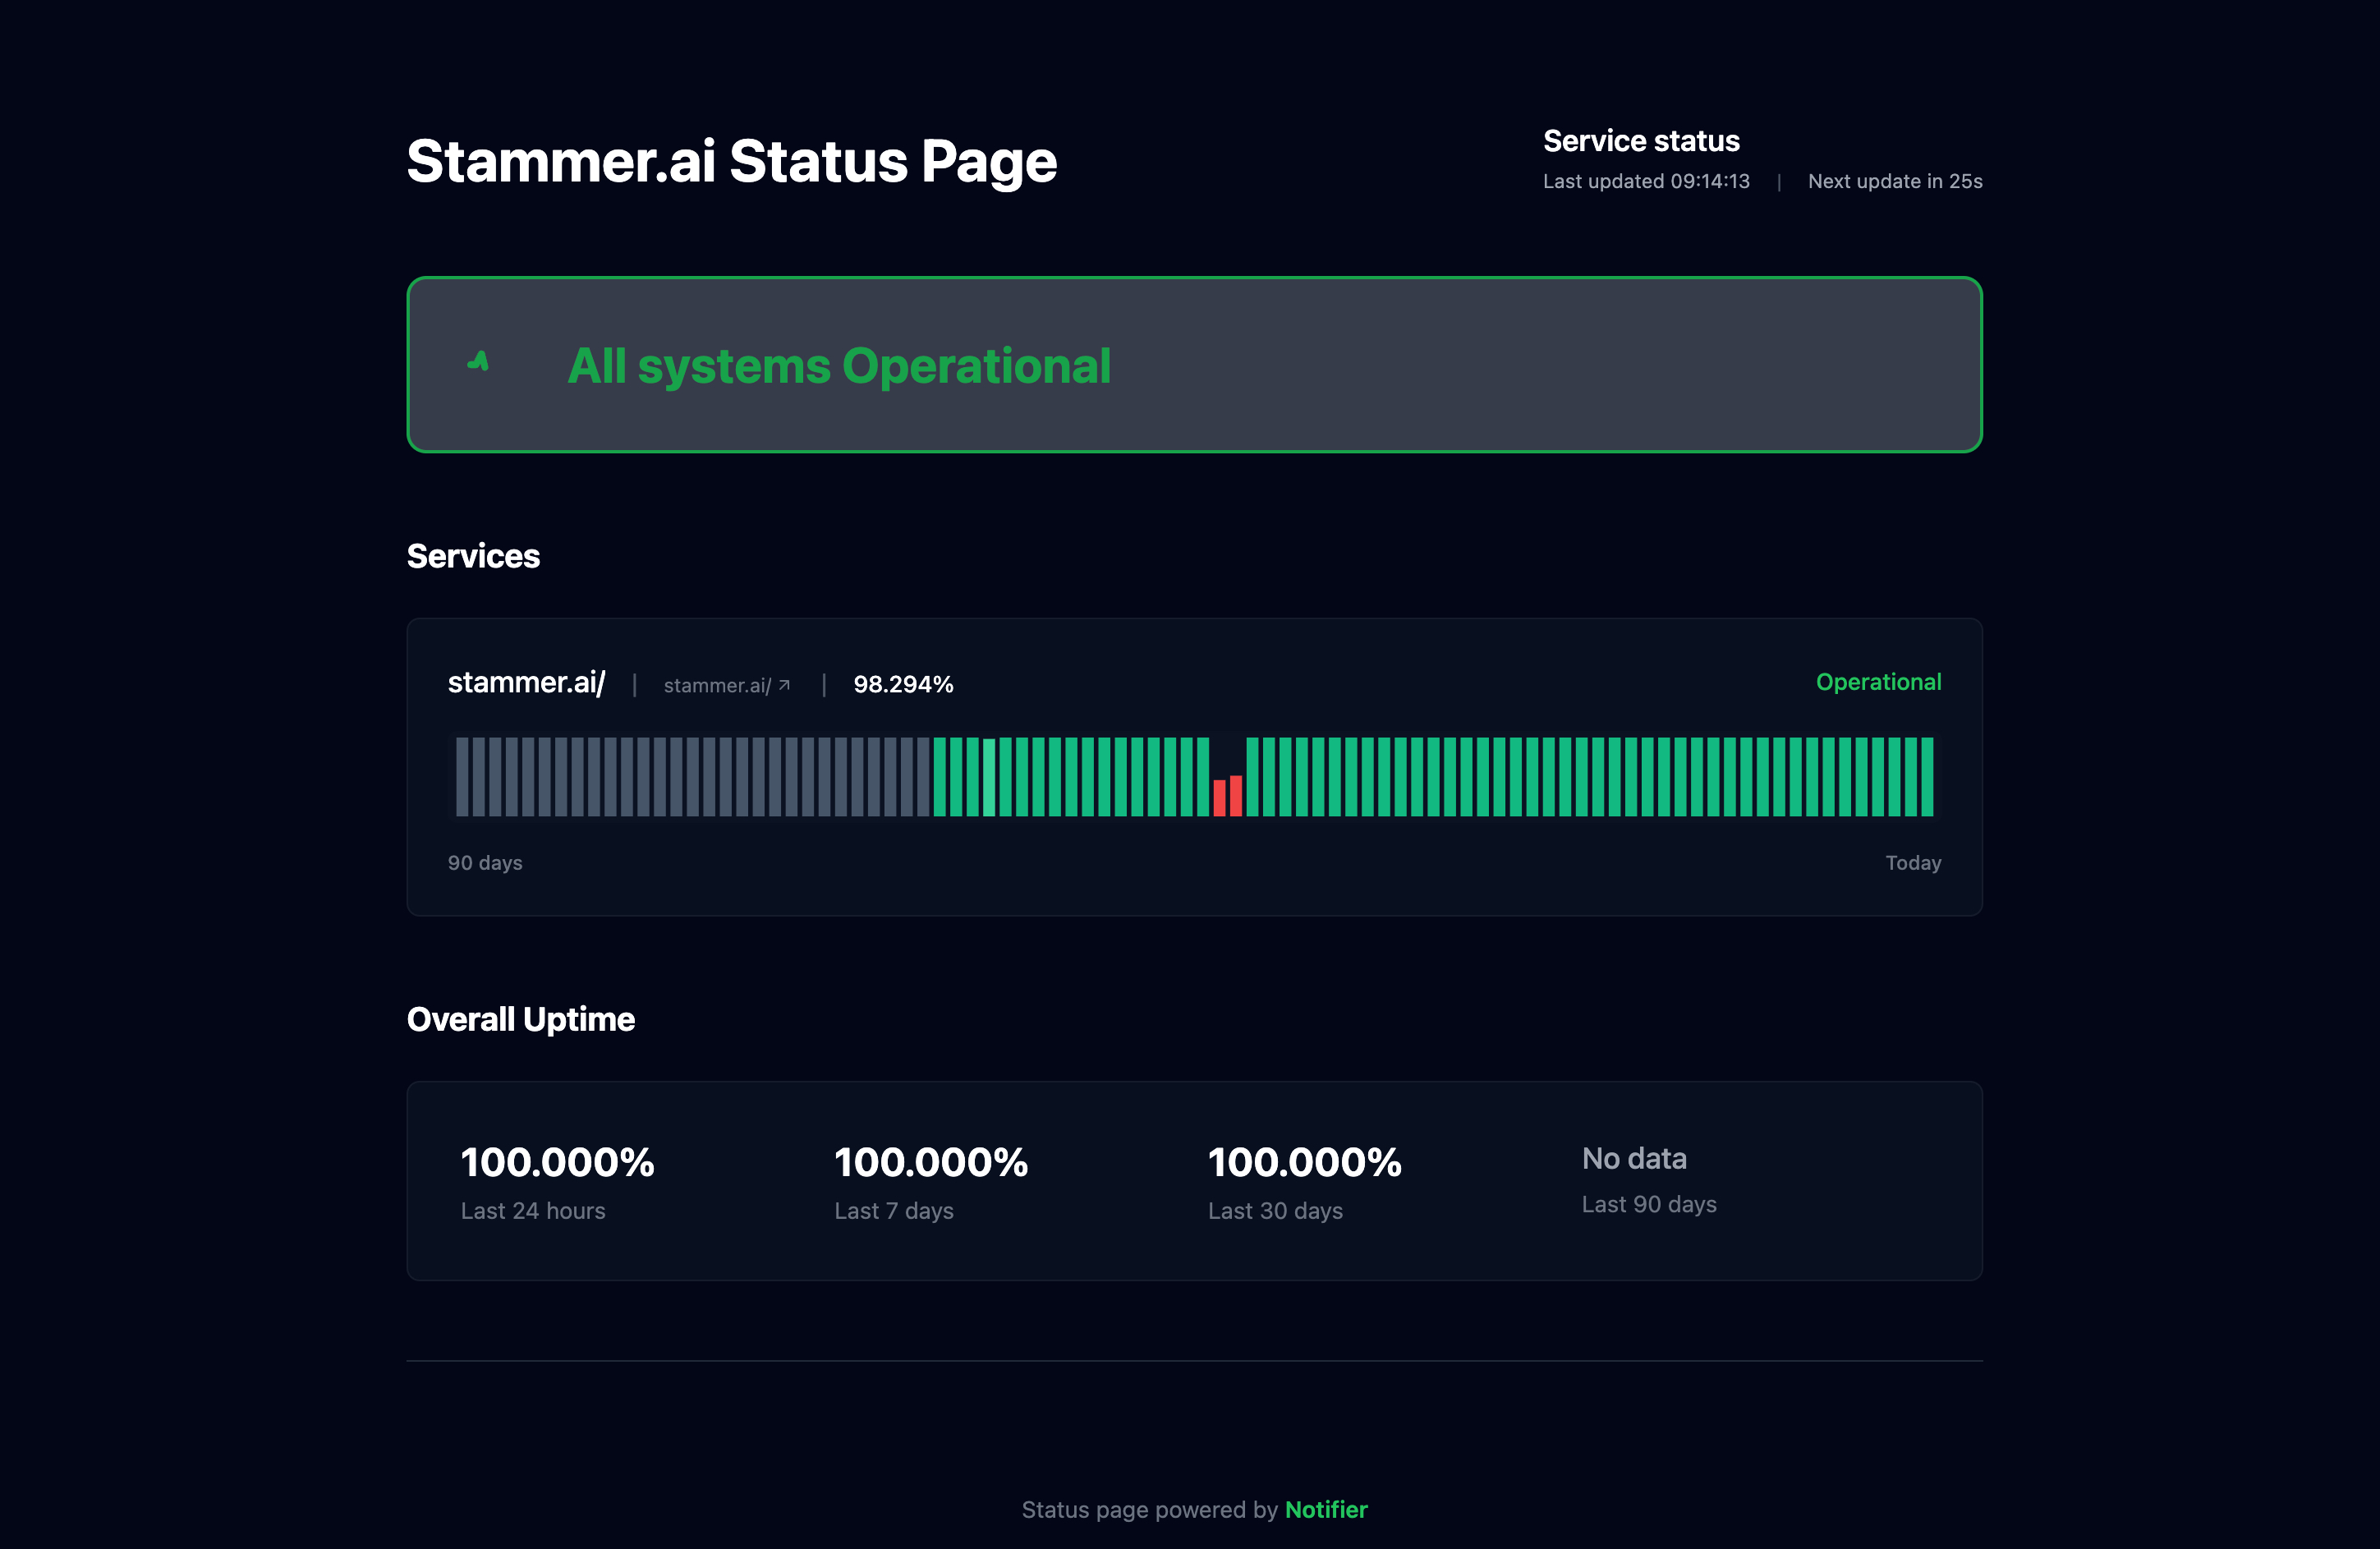
Step 5: Create a Status Page
For public APIs, a status page builds trust with your users. Show the current status of each API endpoint and historical uptime.
API Monitoring Best Practices
Monitor from Multiple Locations
An API might work fine from your data center but fail for users in another region. Use a monitoring service that checks from multiple geographic locations.
Set Realistic Thresholds
Alert on significant degradation, not minor fluctuations:
- Response time alerts: Trigger at 2x or 3x normal latency, not every small spike
- Error rate alerts: Allow for occasional errors (0.1% to 1%), alert on sustained increases
- Avoid alert fatigue: Too many false positives lead to ignored alerts
Test Your Monitoring
Periodically verify that alerts actually work:
- Intentionally break something in staging and confirm alerts fire
- Test that notifications reach the right channels
- Verify that the on-call person received the alert
Integrate with CI/CD
Run API tests as part of your deployment pipeline. Catch issues before they reach production. If post-deployment checks fail, automatically roll back.
Track Historical Trends
Don't just alert on outages. Track response times over weeks and months. Gradually increasing latency often indicates problems before they become outages.
Document Your Monitoring
Keep a record of what's monitored, why, and what to do when alerts fire. When someone gets paged at 3 AM, they should know exactly what to check.
Summary
API monitoring requires more than simple uptime checks. You need to validate responses, handle authentication, and track performance metrics. Start with health check endpoints on critical services, then expand to business-critical API endpoints.
For most teams, a simple monitoring tool like Notifier handles the basics. As you scale, consider adding APM tools for deeper visibility into API performance.